From startups to legacy brands, you're making your mark. We're here to help.
-
Innovation Economy
Fueling the success of early-stage startups, venture-backed and high-growth companies.
-
Midsize Businesses
Keep your company growing with custom banking solutions for middle market businesses and specialized industries.
-
Large Corporations
Innovative banking solutions tailored to corporations and specialized industries.
-
Commercial Real Estate
Capitalize on opportunities and prepare for challenges throughout the real estate cycle.
-
Community Impact Banking
When our communities succeed, we all succeed. Local businesses, organizations and community institutions need capital, expertise and connections to thrive.
-
International Banking
Power your business' global growth and operations at every stage.
Key Links
Prepare for future growth with customized loan services, succession planning and capital for business equipment.
-
Asset Based Lending
Enhance your liquidity and gain the flexibility to capitalize on growth opportunities.
-
Equipment Financing
Maximize working capital with flexible equipment and technology financing.
-
Trade & Working Capital
Experience our market-leading supply chain finance solutions that help buyers and suppliers meet their working capital, risk mitigation and cash flow objectives.
-
Syndicated Financing
Leverage customized loan syndication services from a dedicated resource.
-
Commercial Real Estate
Capitalize on opportunities and prepare for challenges throughout the real estate cycle.
-
Employee Stock Ownership Plans
Plan for your business’s future—and your employees’ futures too—with objective advice and financing.
Key Links
Serving the world's largest corporate clients and institutional investors, we support the entire investment cycle with market-leading research, analytics, execution and investor services.
-
Institutional Investors
Putting your long-tenured investment teams on the line to earn the trust of institutional investors.
-
Markets
Direct access to market leading liquidity harnessed through world-class research, tools, data and analytics.
-
Prime Services
Helping hedge funds, asset managers and institutional investors meet the demands of a rapidly evolving market.
-
Global Research
Leveraging cutting-edge technology and innovative tools to bring clients industry-leading analysis and investment advice.
-
Securities Services Solutions
Helping institutional investors, traditional and alternative asset and fund managers, broker dealers and equity issuers meet the demands of changing markets.
Key Links
Providing investment banking solutions, including mergers and acquisitions, capital raising and risk management, for a broad range of corporations, institutions and governments.
-
Center for Carbon Transition
J.P. Morgan’s center of excellence that provides clients the data and firmwide expertise needed to navigate the challenges of transitioning to a low-carbon future.
-
Corporate Finance Advisory
Corporate Finance Advisory (“CFA”) is a global, multi-disciplinary solutions team specializing in structured M&A and capital markets. Learn more.
-
Development Finance Institution
Financing opportunities with anticipated development impact in emerging economies.
-
Sustainable Solutions
Offering ESG-related advisory and coordinating the firm's EMEA coverage of clients in emerging green economy sectors.
-
Mergers and Acquisitions
Bespoke M&A solutions on a global scale.
-
Capital Markets
Holistic coverage across capital markets.
Your partner for commerce, receivables, cross-currency, working capital, blockchain, liquidity and more.
Key Links
A uniquely elevated private banking experience shaped around you.
-
Banking
We have extensive personal and business banking resources that are fine-tuned to your specific needs.
-
Investing
We deliver tailored investing guidance and access to unique investment opportunities from world-class specialists.
-
Lending
We take a strategic approach to lending, working with you to craft the right financing solutions matched to your goals.
-
Planning
No matter where you are in your life, or how complex your needs might be, we’re ready to provide a tailored approach to helping your reach your goals.
Whether you want to invest on your own or work with an advisor to design a personalized investment strategy, we have opportunities for every investor.
-
Invest on your own
Unlimited $0 commission-free online stock, ETF and options trades with access to powerful tools to research, trade and manage your investments.
-
Work with our advisors
When you work with our advisors, you'll get a personalized financial strategy and investment portfolio built around your unique goals-backed by our industry-leading expertise.
-
Expertise for Substantial Wealth
Our Wealth Advisors & Wealth Partners leverage their experience and robust firm resources to deliver highly-personalized, comprehensive solutions across Banking, Lending, Investing, and Wealth Planning.
Explore a variety of insights.
Key Links
Insights by Topic
Explore a variety of insights organized by different topics.
Key Links
Insights by Type
Explore a variety of insights organized by different types of content and media.
Key Links
We aim to be the most respected financial services firm in the world, serving corporations and individuals in more than 100 countries.
Key Links
- Technology at our firm
- Artificial Intelligence Research
- Initiatives
- Synthetic Data
- Synthetic Equity Market Data
Synthetic Data
Synthetic Equity Market Data
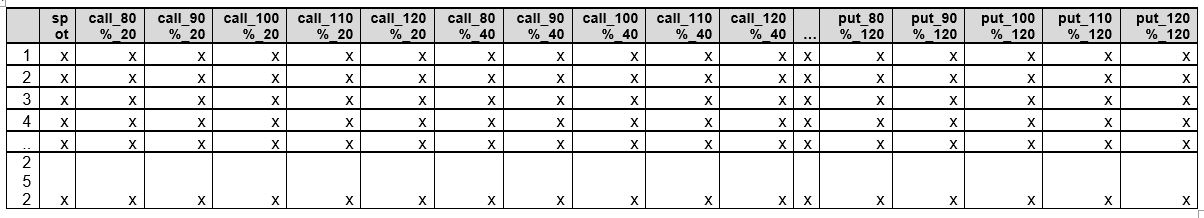
Synthetic equity market data contains simulated time series of spot and option prices for a given asset. Spot is one-dimensional while options are defined on a high-dimensional grid of relative strikes (e.g. [80%, 90%, 100%, 110%, 120%]) and floating maturities (e.g [20, 40, 60, 120]). The time series is on daily interval.
Simulated data is generated by a machine learning model which is trained on data derived from historical spot and option prices. Historical prices are sourced from Bloomberg via RMDS. For spot, we adjust raw prices by removing dividend, borrow and rates impact. For options, an internal vol fitting process is used to convert raw prices to implied volatilities which are then transformed to discrete local volatilities (DLVs). The transformation is mainly to remove possible static arbitrage from the implied vol surface.
The machine learning model is then developed using adjusted spot and DLVs data. In the pipeline, preprocessing is first done to compress high-dimensional data to some low-dimensional representations via an auto encoder. Neural network based generative model is trained on the low-dimensional data. The generative model takes inputs from random noise plus some initial state up to time t, and generates next state at t+1. The objective function is to minimize the distance between the generated (fake) and historical (real) conditional distributions. Once the model is trained, it can generate synthetic low-dimensional data, which is then reconstructed to high-dimensional data via the decoder in auto encoder. The generated high-dimensional data contains synthetic spot and DLVs. DLVs are then converted back to option prices.
The shape of the generated data set is (num_paths, num_days, num_variables). For example, if we want to simulate 10000 paths of an asset’s spot and call option prices for the next 252 days. Using the aforementioned option grid, the shape will be (10000, 252, 21) where 21 is for spot and 20 call options. By default we include put options too, so the shape will be (10000, 252, 41).
Synthetic Equity Market Data
References
1. Deep Hedging: Learning to Simulate Equity Option Markets.
M Wiese, L Bai, B Wood, H Buehler.
2. Conditional Sig-Wasserstein GANs for Time Series Generation..
H Ni, L Szpruch, M Wiese, S Liao, B Xiao.
Would you like to know more about AI Research at J.P. Morgan?
For upcoming workshops and updates, visit:
You're now leaving J.P. Morgan
J.P. Morgan’s website and/or mobile terms, privacy and security policies don’t apply to the site or app you're about to visit. Please review its terms, privacy and security policies to see how they apply to you. J.P. Morgan isn’t responsible for (and doesn’t provide) any products, services or content at this third-party site or app, except for products and services that explicitly carry the J.P. Morgan name.