
Our top market takeaways for November 19, 2021.
Market update: All too well
All things considered, it was a quiet week in markets. Stocks drifted higher, driven by big tech and the #metaverse (whatever that means). Semiconductor stocks got a boost due to data center strength, secular opportunities in automobiles and increased manufacturing capacity in places such as Malaysia. And while the October retail sales report showed a healthy consumer (even after adjusting for inflation), the most economically sensitive sectors (materials, financials and energy) were the worst performers. Nonetheless, the S&P 500 made its 66th new all-time high of the year on Thursday. It only needs 12 more to break the record of 77 set in 1995.
In the aftermath of last week’s inflation reading, bond yields were relatively tame. Markets continue to think the Federal Reserve will embark on a rate-hiking cycle by the middle of next year, and higher short-term interest rates in the United States seem to be drawing in capital. The U.S. dollar is the strongest it has been relative to a basket of other currencies since last June.
As we head into the holiday season, we want to keep our eye on five developments that matter for markets. This week, we want to give a quick update on them.
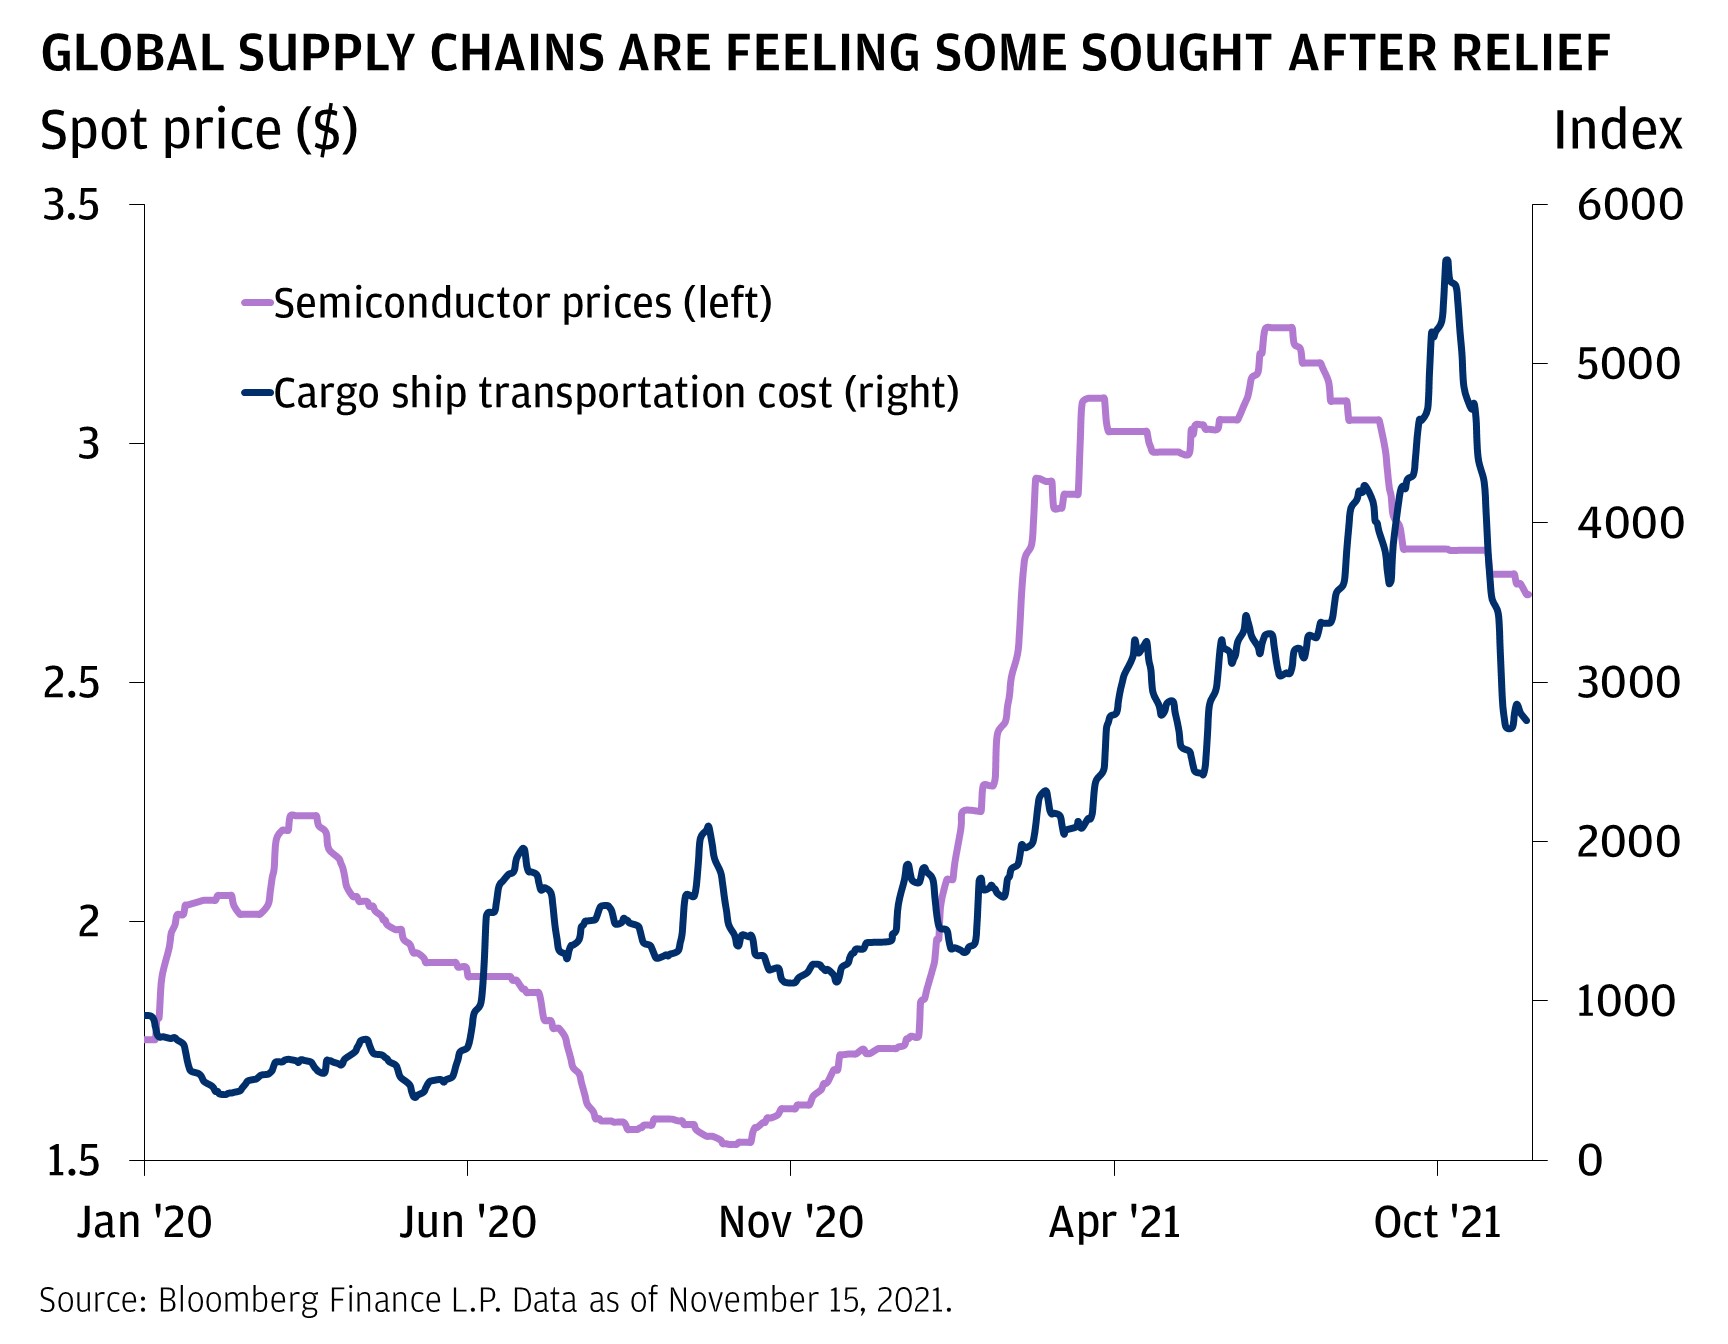
[1] Supply chains: The chaos may be peaking.
But really, where’s my stuff? Delivery times are still super long across the globe, largely due to surging demand for goods in the United States. But, maybe, just maybe, we’re starting to see flickers of hope that the supply chain pain is easing. Semiconductor prices (which soared amid demand for all things digital) have turned lower. U.S. auto production (which has been plagued by the semi shortage) rebounded in October. Cargo ship transportation costs have recently declined, big retailers reported better hiring conditions, and backlogs eased. The number of delinquent containers sitting at the Port of Los Angeles is down by almost 30% since the Port instituted a $100 fine per day for every container that sits idle for more than nine days. And companies such as Walmart have said they expect shelves to be fully stocked ahead of holiday shopping sprees. While we’re not out of the woods yet, the latest trend is certainly encouraging.
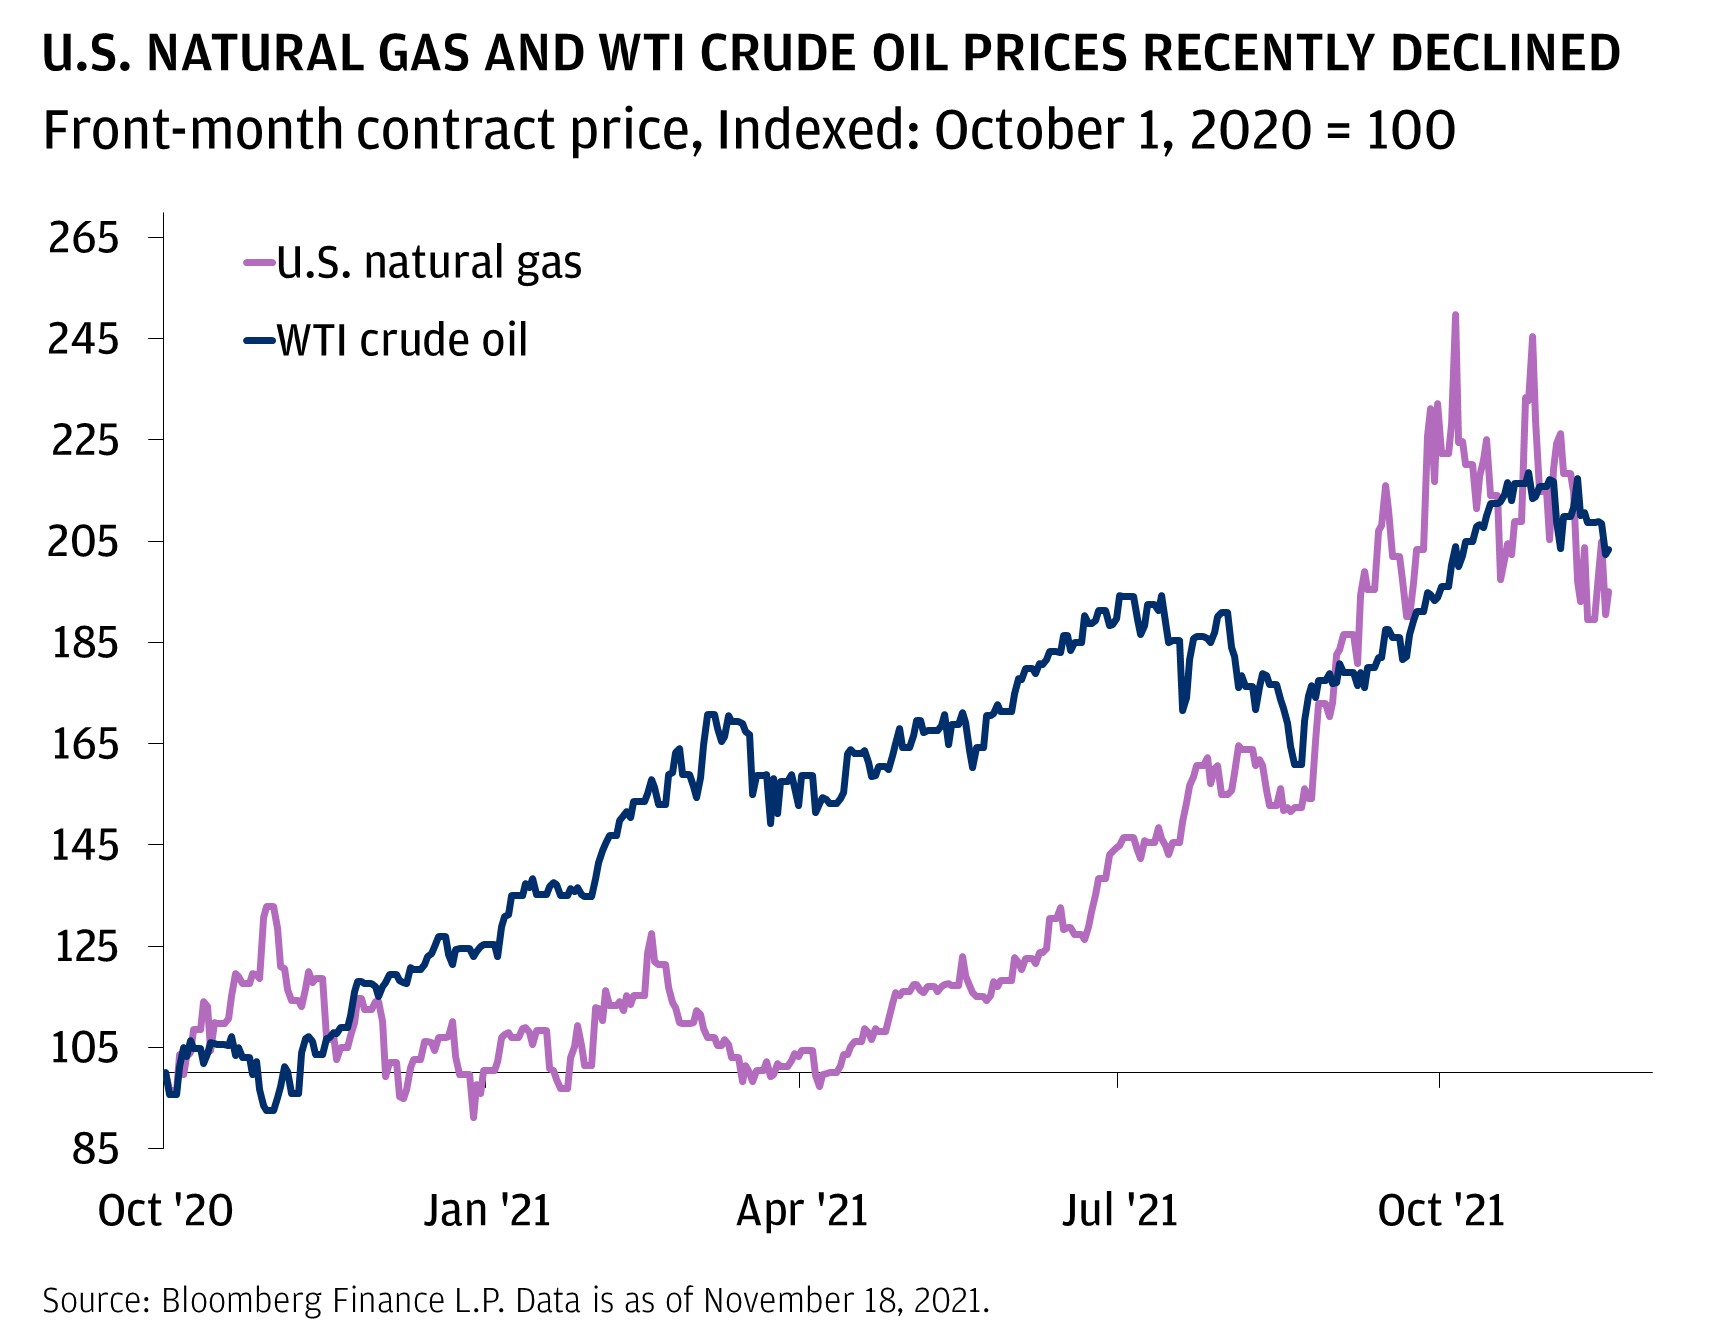
[2] Energy prices: The risk of a winter surge.
Winter is coming. While energy commodities such natural gas and oil are in short supply, it’s possible that the situation is becoming incrementally less severe. For instance, our Investment Bank believes the crude oil market will have excess supply as soon as the first quarter of next year, and even though the supply response has been moderate, the United States has added nearly 200 active rigs so far this year.
Not to mention that politicians have taken notice (even if they have limited control over oil prices). The United States discussed releasing some Strategic Reserves (which hold over 620 million barrels of crude in the Gulf Coast) to add supply to the market, and China may also release some of its reserves.
Indeed, crude oil and gasoline prices are down around -7.5% from peaks, and U.S. natural gas is down -25%. While it is too early to call the top in energy prices, any softening could go a long way to quell the fears around both a winter energy crisis and inflation.
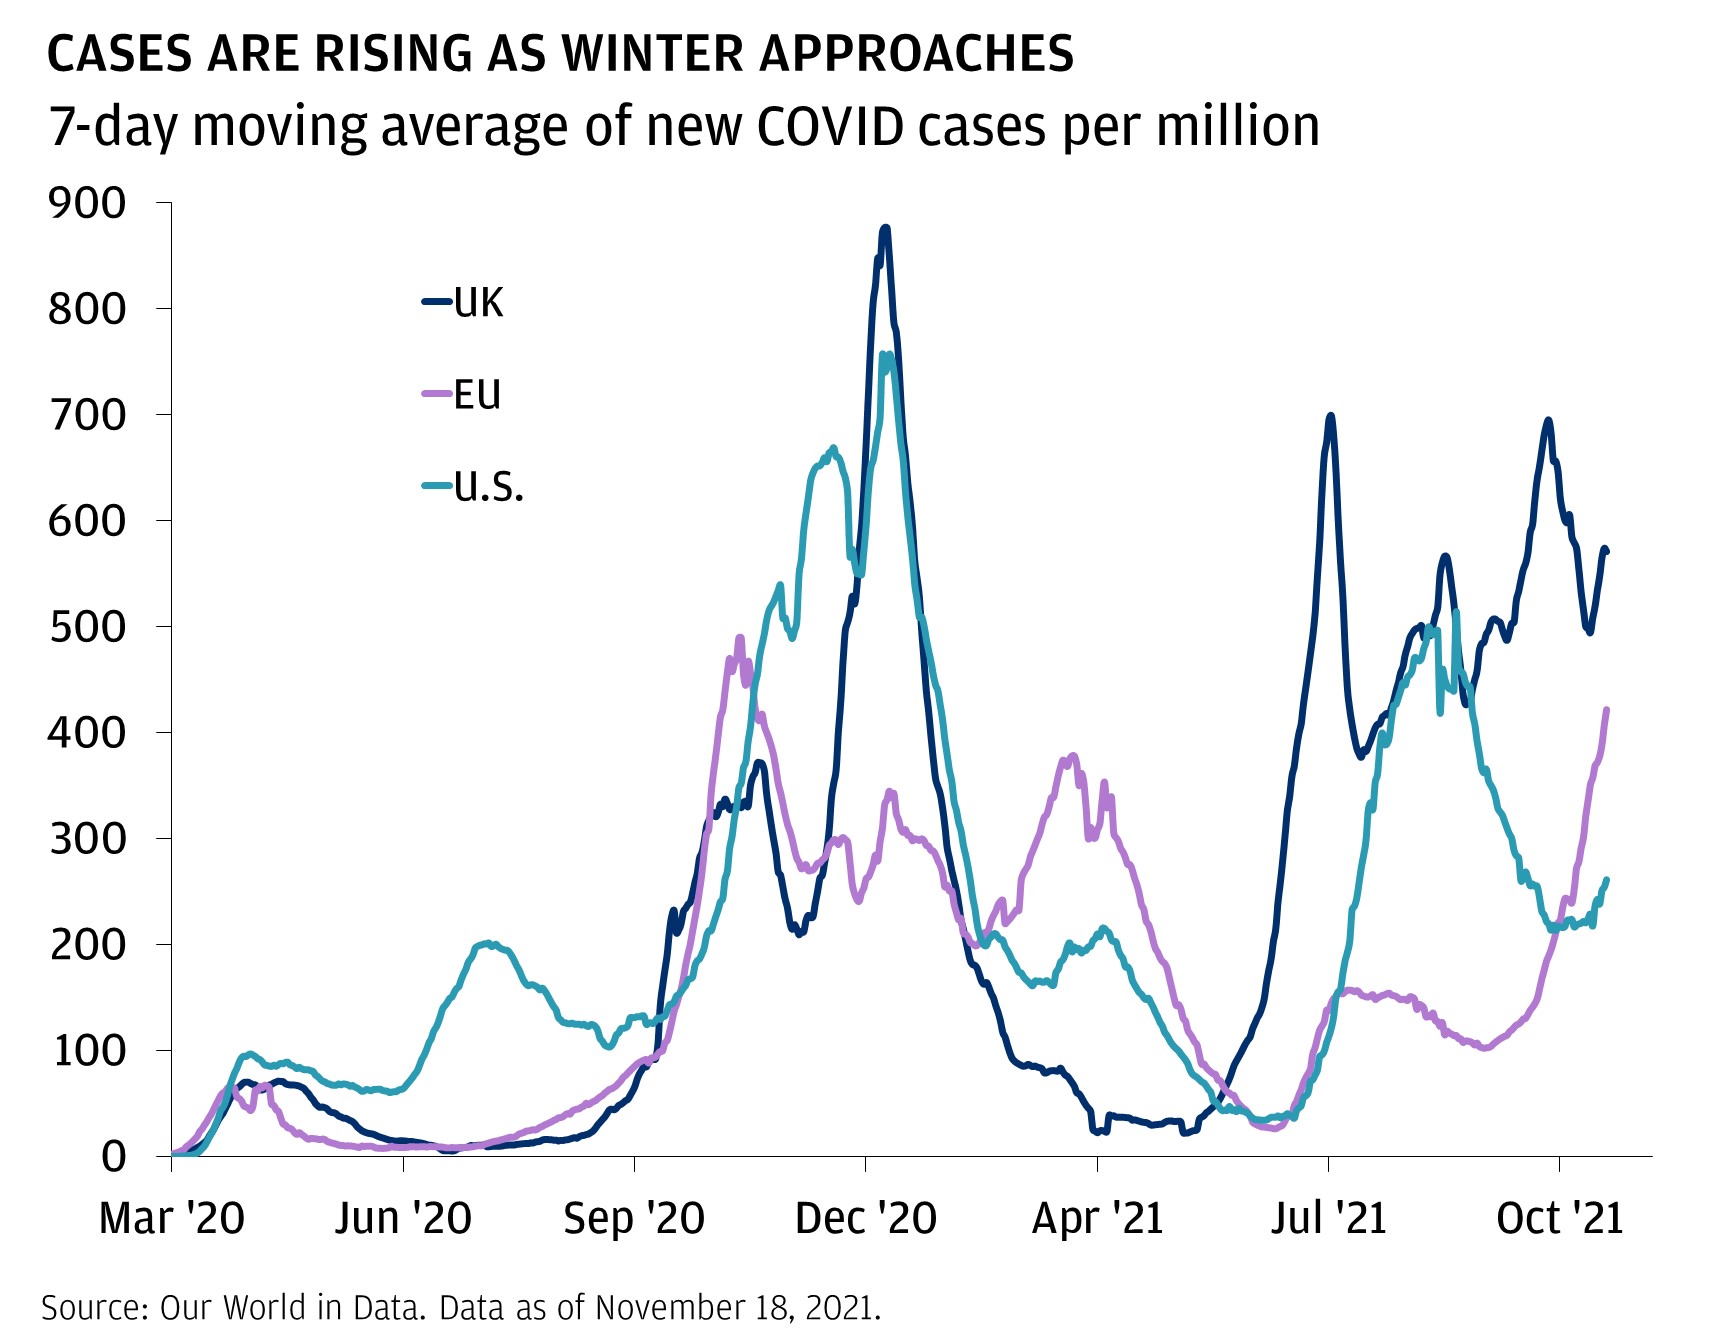
[3] COVID-19 and reopening: Another setback in Europe.
This month marks two years since the first reported COVID-19 case, and while day-to-day life has certainly improved from the throes of lockdown, it’s still anything but normal. Europe is facing an intensifying wave of new infections, accounting for almost 60% of the world’s new COVID-19 cases. Germany broke another record in new cases yesterday. Some policymakers, such as in the Netherlands, Austria and Belgium, are pursuing partial lockdown measures or restrictions on the unvaccinated. Such trends are worrisome, especially as we head further into winter.
Yet, we continue to believe in the power of vaccines, immunity from prior infection, and new treatments in preventing the worst case outcomes. Fifty-two percent of the world’s population has received at least one vaccine dose, compared to 10% in June. Booster shots in a handful of countries are underway. And breakthrough treatments, such as Pfizer’s take-home pill, are already making waves. COVID-19 remains a concern, but the future looks brighter.
[4] Political negotiations: Washington will be busy through the holidays.
In Washington, lawmakers are still hammering out the final details of President Biden’s Build Back Better plan (which targets “social” infrastructure on top of the already passed physical infrastructure plan), discussing the impending debt limit (which could breach on December 15), and deciding who the next Fed Chair will be (current Chair Jerome Powell is the favorite, but if the last two years have taught us anything, it’s to not be surprised by the unexpected). We think the Build Back Better agenda (at least in some form) is likely to be passed before the new year. Given that the spending is almost fully offset by revenue raised, the headline economic impact could be modest. However, some sectors may be supported, and high-income families are likely to see higher taxes, which emphasizes the importance of being mindful around structuring one’s assets.
Meanwhile, President Biden met with Chinese President Xi to discuss, among other things, the (somehow still ongoing) trade war, increasing oil supplies and the Olympics. While we aren’t counting on the tariffs on Chinese imports getting rolled back, it could be an interesting option to improve supply chains and help deal with inflation.
[5] Some assets have lost their magic in 2021.
Peloton is down over -70% as people choose to work out at the gym and not at home. Penn National Gaming, which surged over +450% in 2020, is down over -60% from peak after being left out of New York State’s online sports gaming program. Zoom, the online meeting provider, is down -25% this year as office occupancy continues to tick up. The ARK Innovation ETF, one of the darlings of 2020 and early 2021, is now down almost -30% from highs. Same thing with the SPAC Index.
Safe assets haven’t found any magic this year, either. Long-term bonds are down over -5%. Gold has lost over -2.5% this year and is -10% down from the 2020 highs. The worst-performing equity sectors in the United States are utilities and consumer staples. Earlier this year, we thought it would be best to overweight risky assets relative to “safer” ones, and so far this year that view has proved to be correct.
One area to keep an eye on is clean energy. Broadly, the sector is still down -25% from highs, but it did rally around +20% in the weeks leading up to and during the COP26 conference. It may be set to regain some magic in 2022.
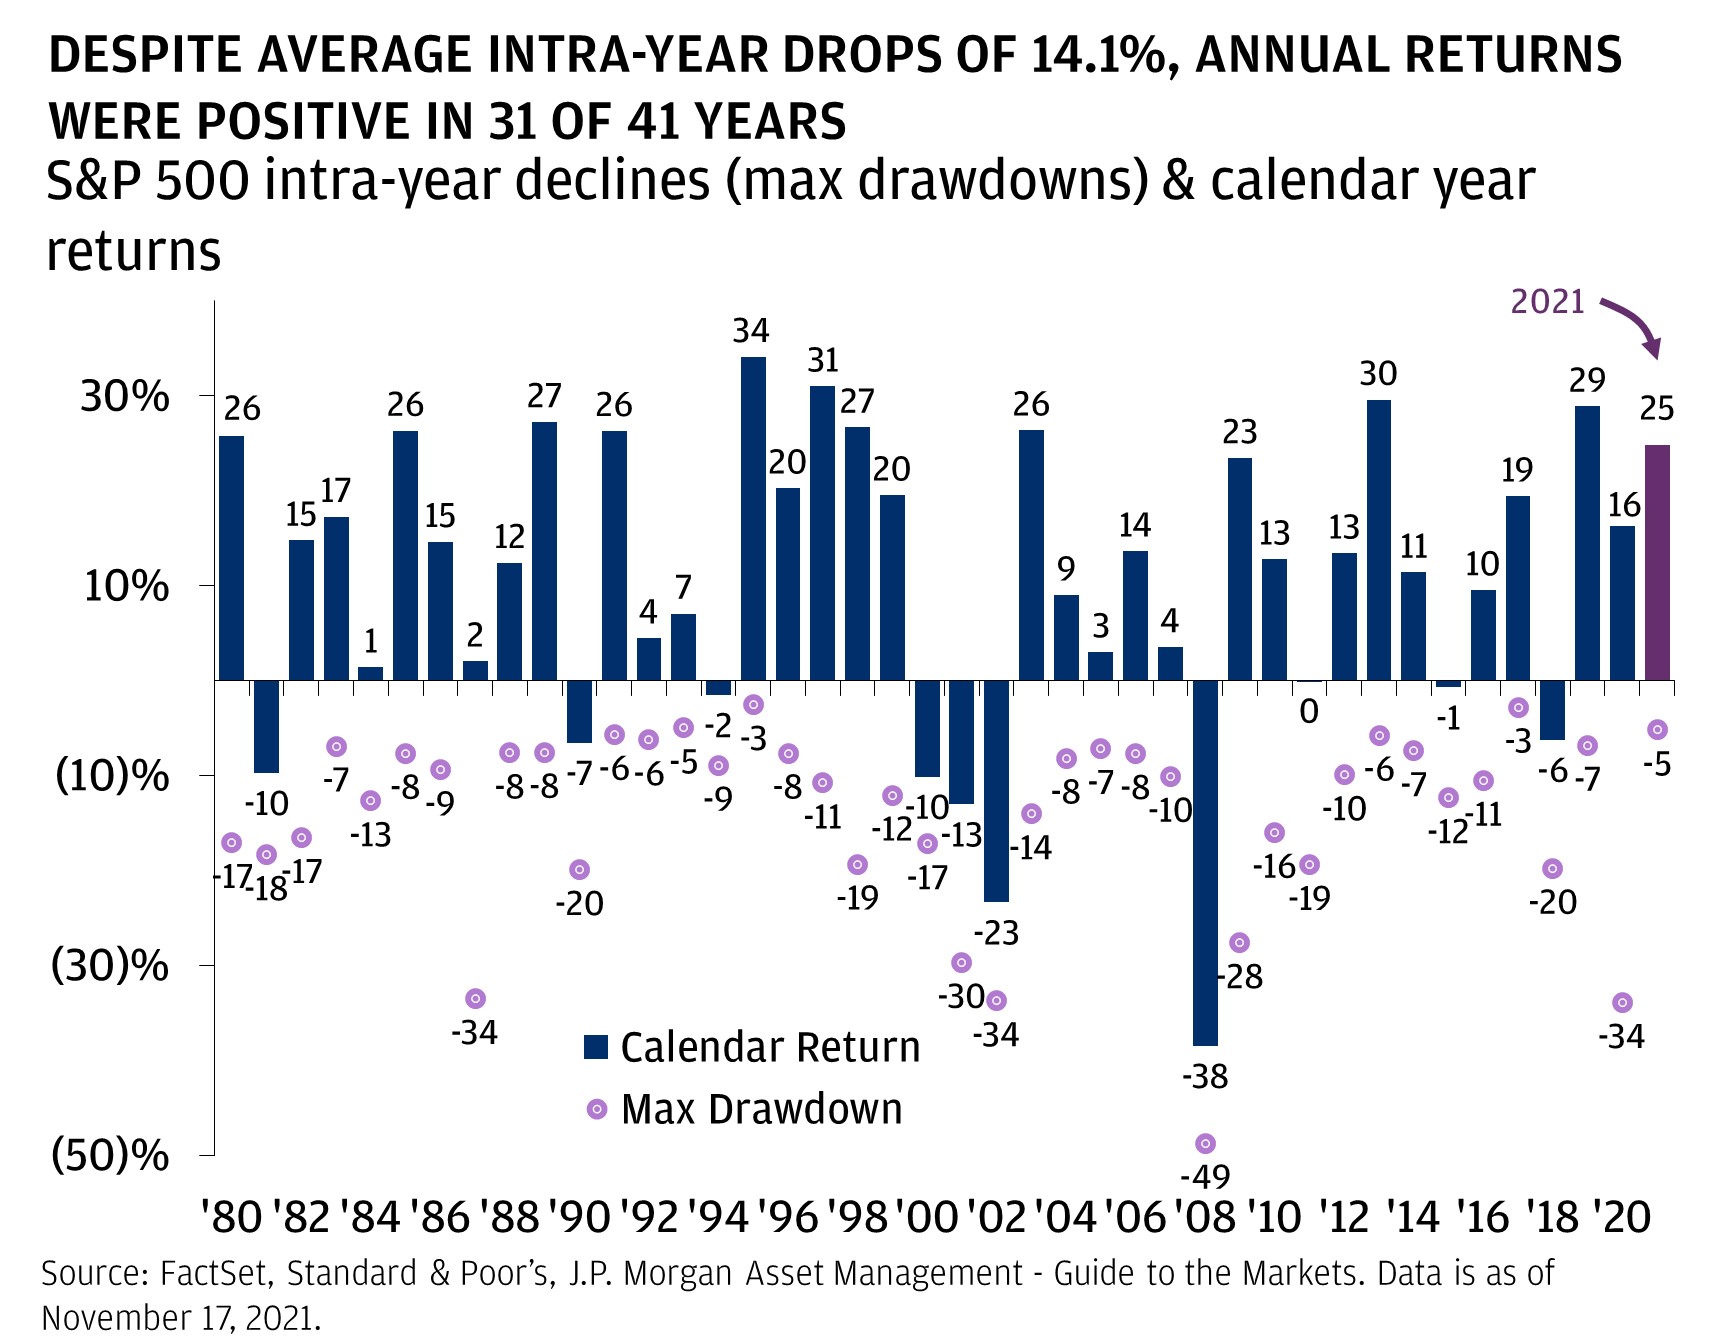
Feeling some angst?
With more record highs in 2021 than there have been weeks in the year, some investors may be questioning when the ball might drop. We continue to believe we are entering a vibrant mid-cycle environment (despite the risks), but we don’t discount the possibility of volatility rearing its head. Importantly, volatility is a mainstay of investing—and the average year since 1980 has seen an S&P 500 drawdown just north of 14%. But even so, the index has ended up on the year over 75% of the time. If history is any indicator, it’s taught us that staying invested tends to benefit over the long term.
All market and economic data as of November 2021 and sourced from Bloomberg and FactSet unless otherwise stated.
We believe the information contained in this material to be reliable but do not warrant its accuracy or completeness. Opinions, estimates, and investment strategies and views expressed in this document constitute our judgment based on current market conditions and are subject to change without notice.
RISK CONSIDERATIONS
- Past performance is not indicative of future results. You may not invest directly in an index.
- The prices and rates of return are indicative, as they may vary over time based on market conditions.
- Additional risk considerations exist for all strategies.
- The information provided herein is not intended as a recommendation of or an offer or solicitation to purchase or sell any investment product or service.
- Opinions expressed herein may differ from the opinions expressed by other areas of J.P. Morgan. This material should not be regarded as investment research or a J.P. Morgan investment research report.
IMPORTANT INFORMATION
All market and economic data as of November 2021 and sourced from Bloomberg and FactSet unless otherwise stated.
All companies referenced are shown for illustrative purposes only, and are not intended as a recommendation or endorsement by J.P. Morgan in this context.
All market and economic data as of November 2021 and sourced from Bloomberg and FactSet unless otherwise stated.
The information presented is not intended to be making value judgments on the preferred outcome of any government decision.
This material is for information purposes only, and may inform you of certain products and services offered by private banking businesses of JPMorgan Chase & Co. (“JPM”). Products and services described, as well as associated fees, charges and interest rates, are subject to change in accordance with the applicable account agreements and may differ among geographic locations. Not all products and services are offered at all locations. If you are a person with a disability and need additional support accessing this material, please contact your J.P. Morgan team or email us at accessibility.support@jpmorgan.com for assistance. Please read all Important Information.
- The MSCI China Index captures large- and mid-cap representation across China H shares, B shares, Red chips, P chips and foreign listings (e.g., ADRs). With 459 constituents, the index covers about 85% of this China equity universe. Currently, the index also includes Large Cap A shares represented at 5% of their free float adjusted market capitalization.
- The Standard and Poor’s 500 Index is a capitalization-weighted index of 500 stocks. The index is designed to measure performance of the broad domestic economy through changes in the aggregate market value of 500 stocks representing all major industries. The index was developed with a base level of 10 for the 1941–43 base period.
- The STOXX Europe 600 Index tracks 600 publicly traded companies based in one of 18 EU countries. The index includes small-cap, medium-cap and large-cap companies. The countries represented in the index are Austria, Belgium, Denmark, Finland, France, Germany, Greece, Holland, Iceland, Ireland, Italy, Luxembourg, Norway, Portugal, Spain, Sweden, Switzerland and the United Kingdom.
GENERAL RISKS & CONSIDERATIONS. Any views, strategies or products discussed in this material may not be appropriate for all individuals and are subject to risks. Investors may get back less than they invested, and past performance is not a reliable indicator of future results. Asset allocation/diversification does not guarantee a profit or protect against loss. Nothing in this material should be relied upon in isolation for the purpose of making an investment decision. You are urged to consider carefully whether the services, products, asset classes (e.g. equities, fixed income, alternative investments, commodities, etc.) or strategies discussed are suitable to your needs. You must also consider the objectives, risks, charges, and expenses associated with an investment service, product or strategy prior to making an investment decision. For this and more complete information, including discussion of your goals/situation, contact your J.P. Morgan team.
NON-RELIANCE. Certain information contained in this material is believed to be reliable; however, JPM does not represent or warrant its accuracy, reliability or completeness, or accept any liability for any loss or damage (whether direct or indirect) arising out of the use of all or any part of this material. No representation or warranty should be made with regard to any computations, graphs, tables, diagrams or commentary in this material, which are provided for illustration/reference purposes only. The views, opinions, estimates and strategies expressed in this material constitute our judgment based on current market conditions and are subject to change without notice. JPM assumes no duty to update any information in this material in the event that such information changes. Views, opinions, estimates and strategies expressed herein may differ from those expressed by other areas of JPM, views expressed for other purposes or in other contexts, and this material should not be regarded as a research report. Any projected results and risks are based solely on hypothetical examples cited, and actual results and risks will vary depending on specific circumstances. Forward-looking statements should not be considered as guarantees or predictions of future events.
Nothing in this document shall be construed as giving rise to any duty of care owed to, or advisory relationship with, you or any third party. Nothing in this document shall be regarded as an offer, solicitation, recommendation or advice (whether financial, accounting, legal, tax or other) given by J.P. Morgan and/or its officers or employees, irrespective of whether or not such communication was given at your request. J.P. Morgan and its affiliates and employees do not provide tax, legal or accounting advice. You should consult your own tax, legal and accounting advisors before engaging in any financial transactions.
IMPORTANT INFORMATION ABOUT YOUR INVESTMENTS AND POTENTIAL CONFLICTS OF INTEREST
Conflicts of interest will arise whenever JPMorgan Chase Bank, N.A. or any of its affiliates (together, “J.P. Morgan”) have an actual or perceived economic or other incentive in its management of our clients’ portfolios to act in a way that benefits J.P. Morgan. Conflicts will result, for example (to the extent the following activities are permitted in your account): (1) when J.P. Morgan invests in an investment product, such as a mutual fund, structured product, separately managed account or hedge fund issued or managed by JPMorgan Chase Bank, N.A. or an affiliate, such as J.P. Morgan Investment Management Inc.; (2) when a J.P. Morgan entity obtains services, including trade execution and trade clearing, from an affiliate; (3) when J.P. Morgan receives payment as a result of purchasing an investment product for a client’s account; or (4) when J.P. Morgan receives payment for providing services (including shareholder servicing, recordkeeping or custody) with respect to investment products purchased for a client’s portfolio. Other conflicts will result because of relationships that J.P. Morgan has with other clients or when J.P. Morgan acts for its own account.
Investment strategies are selected from both J.P. Morgan and third-party asset managers and are subject to a review process by our manager research teams. From this pool of strategies, our portfolio construction teams select those strategies we believe fit our asset allocation goals and forward-looking views in order to meet the portfolio’s investment objective.
As a general matter, we prefer J.P. Morgan managed strategies. We expect the proportion of J.P. Morgan managed strategies will be high (in fact, up to 100 percent) in strategies such as, for example, cash and high-quality fixed income, subject to applicable law and any account-specific considerations.
While our internally managed strategies generally align well with our forward-looking views, and we are familiar with the investment processes as well as the risk and compliance philosophy of the firm, it is important to note that J.P. Morgan receives more overall fees when internally managed strategies are included. We offer the option of choosing to exclude J.P. Morgan managed strategies (other than cash and liquidity products) in certain portfolios.
The Six Circles Funds are U.S.-registered mutual funds managed by J.P. Morgan and sub-advised by third parties. Although considered internally managed strategies, JPMC does not retain a fee for fund management or other fund services.
LEGAL ENTITY, BRAND & REGULATORY INFORMATION
In the United States, bank deposit accounts and related services, such as checking, savings and bank lending, are offered by JPMorgan Chase Bank, N.A. Member FDIC.
JPMorgan Chase Bank, N.A. and its affiliates (collectively “JPMCB”) offer investment products, which may include bank-managed investment accounts and custody, as part of its trust and fiduciary services. Other investment products and services, such as brokerage and advisory accounts, are offered through J.P. Morgan Securities LLC (“JPMS”), a member of FINRA and SIPC. Annuities are made available through Chase Insurance Agency, Inc. (CIA), a licensed insurance agency, doing business as Chase Insurance Agency Services, Inc. in Florida. JPMCB, JPMS and CIA are affiliated companies under the common control of JPM. Products not available in all states.
In Luxembourg, this material is issued by J.P. Morgan Bank Luxembourg S.A. (JPMBL), with registered office at European Bank and Business Centre, 6 route de Treves, L-2633, Senningerberg, Luxembourg. R.C.S Luxembourg B10.958. Authorized and regulated by Commission de Surveillance du Secteur Financier (CSSF) and jointly supervised by the European Central Bank (ECB) and the CSSF. J.P. Morgan Bank Luxembourg S.A. is authorized as a credit institution in accordance with the Law of 5th April 1993. In the United Kingdom, this material is issued by J.P. Morgan Bank Luxembourg S.A., London Branch, registered office at 25 Bank Street, Canary Wharf, London E14 5JP. Authorized and regulated by Commission de Surveillance du Secteur Financier and jointly supervised by the European Central Bank and the CSSF. Deemed authorized by the Prudential Regulation Authority. Subject to regulation by the Financial Conduct Authority and limited regulation by the Prudential Regulation Authority. Details of the Temporary Permissions Regime, which allows EEA-based firms to operate in the United Kingdom for a limited period while seeking full authorization, are available on the Financial Conduct Authority’s website. In Spain, materials are distributed by J.P. Morgan Bank Luxembourg S.A., Sucursal en España at its registered address: Paseo de la Castellana 31, Madrid 28046, Spain. J.P. Morgan Bank Luxembourg S.A., is authorized and regulated by Commission de Surveillance du Secteur Financier (CSSF) and jointly supervised by the European Central Bank (ECB) and the CSSF. When acting through the Madrid branch, is also subject to the supervision of Bank of Spain and CNMV. Registered with Bank of Spain as a branch of J.P. Morgan Bank Luxembourg S.A. under code 1516. In Germany, this material is distributed by J.P. Morgan Bank Luxembourg S.A., Frankfurt Branch, at its registered address Taunustor 1 (TaunusTurm), 60310 Frankfurt am Main, Germany. J.P. Morgan Bank Luxembourg S.A. is authorized and regulated by Commission de Surveillance du Secteur Financier (CSSF) and jointly supervised by the European Central Bank (ECB) and the CSSF. J.P. Morgan Bank Luxembourg S.A., Frankfurt Branch is subject to regulation by the Federal Financial Supervisory Authority (Bundesanstalt für Finanzdienstleistungsaufsicht (BaFin)) in Germany. In Italy, this material is distributed by J.P. Morgan Bank Luxembourg S.A., Milan Branch, registered office at Via Cordusio 3, 20123 Milano, Italy. Authorized and regulated by Commission de Surveillance du Secteur Financier (CSSF) and jointly supervised by the European Central Bank (ECB) and the CSSF. When acting through the Milan branch, J.P. Morgan Bank Luxembourg S.A. is also subject to the supervision of Banca d’Italia CONSOB. Milan Chamber of Commerce Registered Number: REA MI-2542712. Registered with Bank of Italy as a branch of J.P. Morgan Bank Luxembourg S.A. under code 8079. In the Netherlands, this material is distributed by J.P. Morgan Bank Luxembourg S.A., Amsterdam Branch, at its registered address World Trade Centre, B-toren, Strawinskylaan 1135, 1077 XX, Amsterdam, The Netherlands. J.P. Morgan Bank Luxembourg S.A., Amsterdam Branch is authorized and regulated by the Commission de Surveillance du Secteur Financier (CSSF) and jointly supervised by the European Central Bank (ECB) and the CSSF in Luxembourg; J.P. Morgan Bank Luxembourg S.A., Amsterdam Branch is also authorized and supervised by De Nederlandsche Bank (DNB) and the Autoriteit Financiële Markten (AFM) in the Netherlands. Registered with the Kamer van Koophandel as a branch of J.P. Morgan Bank Luxembourg S.A. under registration number 71651845. In Denmark, this material is distributed by J.P. Morgan Bank Luxembourg, Copenhagen Br, filial af J.P. Morgan Bank Luxembourg S.A. at its registered office at Kalvebod Brygge 39-41, 1560 København V, Denmark. Business Authority Number: 39608510 (CVR). J.P. Morgan Bank Luxembourg S.A. is authorized and regulated by Commission de Surveillance du Secteur Financier (CSSF) and jointly supervised by the European Central Bank (ECB) and the CSSF. When acting through the Copenhagen branch, J.P. Morgan Bank Luxembourg, Copenhagen Br, filial af J.P. Morgan Bank Luxembourg S.A. is also subject to the supervision of Finanstilsynet (Danish FSA) and registered with Finanstilsynet as a branch of J.P. Morgan Bank Luxembourg S.A. under code 29009. In Sweden, this material is distributed by J.P. Morgan Bank Luxembourg S.A., Stockholm Bankfilial, at its registered office at Hamngatan 15, Stockholm, 11147, Sweden. J.P. Morgan Bank Luxembourg S.A. is authorized and regulated by Commission de Surveillance du Secteur Financier (CSSF) and jointly supervised by the European Central Bank (ECB) and the CSSF. When acting through the Stockholm branch, it is also subject to the supervision of Finansinspektionen (Swedish FSA). Registered with Finansinspektionen as a branch of J.P. Morgan Bank Luxembourg S.A. Organization Reference Number: 516406-1086. In France, this material is distributed by JPMorgan Chase Bank, N.A. (“JPMCB”), Paris branch, which is regulated by the French banking authorities the Autorité de Contrôle Prudentiel et de Résolution and the Autorité des Marchés Financiers. In Switzerland, this material is distributed by J.P. Morgan (Suisse) SA, with registered address at rue de la Confédération, 8, 1204, Geneva, Switzerland, which is authorized and supervised by the Swiss Financial Market Supervisory Authority (FINMA), with registered address at Laupenstrasse 27, 3003, Bern, Switzerland, as a bank and a securities dealer in Switzerland.
This communication is an advertisement for the purposes of the Markets in Financial Instruments Directive (MIFID II) and the Swiss Financial Services Act (FINSA). Investors should not subscribe for or purchase any financial instruments referred to in this advertisement except on the basis of information contained in any applicable legal documentation, which is or shall be made available in the relevant jurisdictions (as required).
In Hong Kong, this material is distributed by JPMCB, Hong Kong branch. JPMCB, Hong Kong branch is regulated by the Hong Kong Monetary Authority and the Securities and Futures Commission of Hong Kong.In Hong Kong, we will cease to use your personal data for our marketing purposes without charge if you so request. In Singapore, this material is distributed by JPMCB, Singapore branch. JPMCB, Singapore branch is regulated by the Monetary Authority of Singapore. Dealing and advisory services and discretionary investment management services are provided to you by JPMCB, Hong Kong/Singapore branch (as notified to you). Banking and custody services are provided to you by JPMCB Singapore Branch. The contents of this document have not been reviewed by any regulatory authority in Hong Kong, Singapore or any other jurisdictions. You are advised to exercise caution in relation to this document. If you are in any doubt about any of the contents of this document, you should obtain independent professional advice. For materials which constitute product advertisement under the Securities and Futures Act and the Financial Advisers Act, this advertisement has not been reviewed by the Monetary Authority of Singapore. JPMorgan Chase Bank, N.A. is a national banking association chartered under the laws of the United States, and as a body corporate, its shareholder’s liability is limited.
With respect to countries in Latin America, the distribution of this material may be restricted in certain jurisdictions. We may offer and/or sell to you securities or other financial instruments which may not be registered under, and are not the subject of a public offering under, the securities or other financial regulatory laws of your home country. Such securities or instruments are offered and/or sold to you on a private basis only. Any communication by us to you regarding such securities or instruments, including without limitation the delivery of a prospectus, term sheet or other offering document, is not intended by us as an offer to sell or a solicitation of an offer to buy any securities or instruments in any jurisdiction in which such an offer or a solicitation is unlawful. Furthermore, such securities or instruments may be subject to certain regulatory and/or contractual restrictions on subsequent transfer by you, and you are solely responsible for ascertaining and complying with such restrictions. To the extent this content makes reference to a fund, the Fund may not be publicly offered in any Latin American country, without previous registration of such fund’s securities in compliance with the laws of the corresponding jurisdiction. Public offering of any security, including the shares of the Fund, without previous registration at Brazilian Securities and Exchange Commission—CVM is completely prohibited. Some products or services contained in the materials might not be currently provided by the Brazilian and Mexican platforms.
JPMorgan Chase Bank, N.A. (JPMCBNA) (ABN 43 074 112 011/AFS Licence No: 238367) is regulated by the Australian Securities and Investment Commission and the Australian Prudential Regulation Authority. Material provided by JPMCBNA in Australia is to “wholesale clients” only. For the purposes of this paragraph the term “wholesale client” has the meaning given in section 761G of the Corporations Act 2001 (Cth). Please inform us if you are not a Wholesale Client now or if you cease to be a Wholesale Client at any time in the future.
JPMS is a registered foreign company (overseas) (ARBN 109293610) incorporated in Delaware, U.S.A. Under Australian financial services licensing requirements, carrying on a financial services business in Australia requires a financial service provider, such as J.P. Morgan Securities LLC (JPMS), to hold an Australian Financial Services Licence (AFSL), unless an exemption applies. JPMS is exempt from the requirement to hold an AFSL under the Corporations Act 2001 (Cth) (Act) in respect of financial services it provides to you, and is regulated by the SEC, FINRA and CFTC under U.S. laws, which differ from Australian laws. Material provided by JPMS in Australia is to “wholesale clients” only. The information provided in this material is not intended to be, and must not be, distributed or passed on, directly or indirectly, to any other class of persons in Australia. For the purposes of this paragraph the term “wholesale client” has the meaning given in section 761G of the Act. Please inform us immediately if you are not a Wholesale Client now or if you cease to be a Wholesale Client at any time in the future.
This material has not been prepared specifically for Australian investors. It:
- May contain references to dollar amounts which are not Australian dollars;
- May contain financial information which is not prepared in accordance with Australian law or practices;
- May not address risks associated with investment in foreign currency denominated investments; and
- Does not address Australian tax issues.
References to “J.P. Morgan” are to JPM, its subsidiaries and affiliates worldwide.“J.P. Morgan Private Bank” is the brand name for the private banking business conducted by JPM. This material is intended for your personal use and should not be circulated to or used by any other person, or duplicated for non-personal use, without our permission. If you have any questions or no longer wish to receive these communications, please contact your J.P. Morgan team.
Check the background of our firm and investment professionals on FINRA's BrokerCheck
To learn more about J. P. Morgan Wealth Management’s investment business, including our accounts, products and services, as well as our relationship with you, please review our J.P. Morgan Securities LLC Form CRS and Guide to Investment Services and Brokerage Products.
This website is for informational purposes only, and not an offer, recommendation or solicitation of any product, strategy service or transaction. Any views, strategies or products discussed on this site may not be appropriate or suitable for all individuals and are subject to risks. Prior to making any investment or financial decisions, an investor should seek individualized advice from a personal financial, legal, tax and other professional advisors that take into account all of the particular facts and circumstances of an investor's own situation.
This website may provide information about the brokerage and investment advisory services provided by J.P. Morgan Securities LLC ("JPMS"). When JPMS acts as a broker-dealer, a client's relationship with us and our duties to the client will be different in some important ways than a client's relationship with us and our duties to the client when we are acting as an investment advisor. A client should carefully read the agreements and disclosures received (including our Form ADV disclosure brochure, if and when applicable) in connection with our provision of services for important information about the capacity in which we will be acting.
INVESTMENT AND INSURANCE PRODUCTS ARE:
• NOT FDIC INSURED • NOT INSURED BY ANY FEDERAL GOVERNMENT AGENCY • NOT A DEPOSIT OR OTHER OBLIGATION OF, OR GUARANTEED BY, JPMORGAN CHASE BANK, N.A. OR ANY OF ITS AFFILIATES • SUBJECT TO INVESTMENT RISKS, INCLUDING POSSIBLE LOSS OF THE PRINCIPAL AMOUNT INVESTED

J.P. Morgan Wealth Management is a business of JPMorgan Chase & Co., which offers investment products and services through J.P. Morgan Securities LLC (JPMS), a registered broker-dealer and investment adviser, member FINRA and SIPC Insurance products are made available through Chase Insurance Agency, Inc. (CIA), a licensed insurance agency, doing business as Chase Insurance Agency Services, Inc. in Florida. Certain custody and other services are provided by JPMorgan Chase Bank, N.A. (JPMCB). JPMS, CIA and JPMCB are affiliated companies under the common control of JPMorgan Chase & Co. Products not available in all states.
Please read additional Important Information in conjunction with these pages.
You're now leaving J.P. Morgan
J.P. Morgan’s website and/or mobile terms, privacy and security policies don’t apply to the site or app you're about to visit. Please review its terms, privacy and security policies to see how they apply to you. J.P. Morgan isn’t responsible for (and doesn’t provide) any products, services or content at this third-party site or app, except for products and services that explicitly carry the J.P. Morgan name.