Risk as a Service provides access to J.P. Morgan’s quantitative models and market data, helping you make informed risk management decisions and trade with confidence. Powered by analytics and technology built for and used by our market-leading trading desks, Risk as a Service is the culmination of decades of investment by our Markets business.
This powerful, yet easy-to-use toolkit supports sophisticated quantitative analysis of your portfolios and real-time monitoring of your risk profile and P&L drivers. Risk as a Service is a fully hosted and managed solution, ensuring ease of adoption and cost-efficiency.
Core features
Explore the ways in which Risk as a Service can help you sharpen your competitive edge
Asset coverage
Risk as a Service offers the intelligence of J.P. Morgan’s FX trading franchise, a market-leading FX cash and options liquidity provider, in risk management for a wide spectrum of vanilla and exotic instruments across developed and emerging market currencies.
Leverage a broad spectrum of scenario-driven analytics for your cash and derivatives portfolios to help you monitor how risk profile and valuations evolve over spot, volatility and time ranges.
Track upcoming trade activity and preview trade lifecycle events across your portfolios. Leverage Risk as a Service to monitor cash flows for cash books, and monitor strike topographies, barrier delta gaps, and pin risks for FX options portfolios.
Intraday, End of Day, and Historical P&L Explain analytics provide you the ability to break down decay measures, disassemble the contribution of volatility surface movements, and identify sensitivities to mixing weights in exotic books, empowering you to identify and resolve inefficiencies and enhance performance.
Risk as a Service for Rates & Credit offers you the cumulative benefits of J.P. Morgan’s extensive investment in Fixed Income quantitative modelling and risk management technology. Leverage sophisticated real-time risk/P&L analytics and derived market data across cash and derivatives, as used by our own market-leading Fixed Income traders, so you can trade with confidence in your precise risk exposures and P&L drivers.
Detailed risk-based P&L Explain, providing breakdown of attribution factors for each instrument type across linear (IR01, XCCY & Tenor Basis, Carry etc.) and non-linear (Rates Gamma & Vega, etc.) risk attributes.
Risk as a Service
Providing clients with J.P. Morgan’s comprehensive and cost-effective risk management capabilities.
Risk as a
Service
Providing clients with J.P. Morgan’s comprehensive and cost-effective risk management capabilities.
Logo: J.P. Morgan.
Text on screen:
J.P. Morgan - Risk as Service.
The power of J.P. Morgan's market-leading quantitative analytics and real-time risk-management technology, delivered seamlessly to your desktop.
A computer screen displays a dashboard showing data regarding:
- Profit and Loss Activity;
- Headline Risk;
- Risk Detail;
- (and) more.
Leverage J.P. Morgan's intraday and end of day pricing marks, proprietary discount curves and volatility surface construction algorithms.
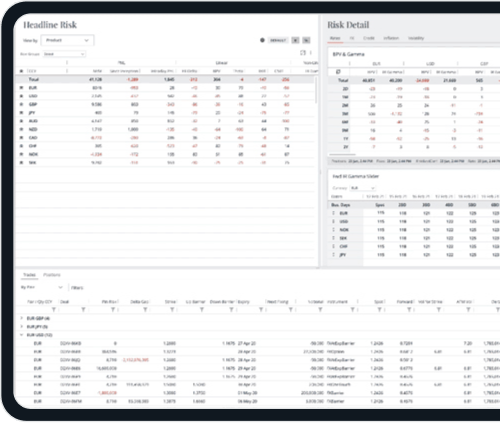
The computer displays a screen, reading "Headline Risk" - with detailed data in columns marked:
- Linear;
- Analytics;
- (and) Non-Linear.
On the screen, a tile labeled "Risk Detail" shows a chart labeled "IR01 & IR Gamma."
And access the same multi-asset risk and Profit and Loss analytics used by our own traders and risk officers.
The computer screen displays detailed financial information. A tile labeled "Headline Risk" shows tabs marked:
- Delta/Gamma;
- Vega;
- PnL;
- (and) Rho.
A tile labeled "Risk Detail" shows tabs marked:
- All Greeks;
- Spot;
- Volatility;
- Volatility Surface;
- Time;
- (and) Exotics.
Monitor your risk profile and Profit & Loss drivers in real-time using sophisticated quantitative analysis. The screen displays a line graph labeled "Profit & Loss Details." The graph shows:
- Total PnL This Period;
- (and) Spot PnL This Period.
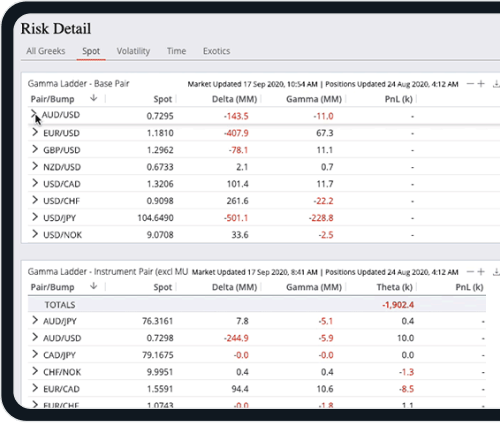
Access analytics through a comprehensive web interface or programmatically via well-defined RESTful APIs. The computer screen displays detailed financial data, in columns marked:
- pair;
- bump;
- spot;
- scaled Delta;
- scaled Gamma;
- and theta.
The screen displays detailed information in response to the typed query: "How does theta evolve over time under different EUR slash JPY spot rate scenarios?"
Fully hosted and delivered "as a service," providing a cost-effective alternative to in-house or third-party technology installations. Our dedicated global support team provides white-glove client service from onboarding through to "day-to-day" use.
Now, a short montage shows a support team specialist reviewing data on multiple computer monitors, as she speaks on the telephone with a client. In a large J.P. Morgan building, office lights remain on, as night falls.
J.P. Morgan - Risk as Service. Trade, invest, and manage risk - with confidence. Learn more:
www.jpmorgan.com/riskasaservice.
Logo: J.P. Morgan.
Tailored to your needs
Leverage extensive exotic instrument coverage, comprehensive derived market data across developed and emerging markets, sophisticated real-time risk analytics, and scenario analysis to gain a trading edge
Employ proven analytics to enhance risk management workflows as your operations expand into new markets and regions
View and manage risk and performance for cash and derivative instruments across portfolios and strategies with a scalable, integrated platform
Deliver client advice with confidence, based on accurate real-time risk and performance analytics for clients’ trading strategies
Get in touch

Markets
Marketing-leading research and trade execution across multiple asset classes, including credit, equity and FX.

Execute
Electronic trading solutions available on J.P. Morgan Markets.

Data and Analytics
J.P. Morgan’s comprehensive suite of data, analytics and risk solutions
FOR INSTITUTIONAL & PROFESSIONAL CLIENTS ONLY
J.P. Morgan is a marketing name for businesses of JPMorgan Chase & Co. and its subsidiaries and affiliates worldwide. JPMorgan Chase Bank, N.A., organized under the laws of the U.S.A. with limited liability, is authorized by the Office of the Comptroller of the Currency in the jurisdiction of the U.S.A., as well as the regulations of the countries in which it or its affiliates undertake regulated activities.
The content of this website is provided for informational purposes only and is not intended as a recommendation or an offer or solicitation for the purchase or sale of any security or financial instrument. Any data and other information contained herein are not warranted as to completeness or accuracy and are subject to change without notice. Nothing on this website should be construed as legal, regulatory, tax, accounting, investment or other advice. The recipient must make an independent assessment of any legal, credit, tax, regulatory and accounting issues and determine with its own professional advisors any suitability or appropriateness implications and consequences of any transaction in the context of its particular circumstances. J.P. Morgan disclaims any responsibility or liability to the fullest extent permitted by applicable law, whether in contract, tort (including, without limitation, negligence), equity or otherwise, for any loss or damage arising from any reliance on or the use of any information on this website.
The products and services described on this website are offered by JPMorgan Chase Bank, N.A. or its affiliates subject to applicable laws and regulations and service terms. Not all products and services are available in all locations. Eligibility for particular products and services will be determined by JPMorgan Chase Bank, N.A. and/or its affiliates.
The products and services described in this website are produced and distributed on behalf of the entities offering Corporate and Investment Banking activities including but not limited to JPMorgan Chase Bank N.A. (including through its authorized branches), J.P. Morgan AG, J.P. Morgan Bank Luxembourg S.A. (including its authorised branches), J.P Morgan Bank (Ireland) Plc, J.P. Morgan (Suisse) SA, J.P. Morgan Europe Limited and its authorised branches, J.P. Morgan Securities LLC and J.P. Morgan Securities plc. For additional regulatory disclosures regarding these entities, please consult: www.jpmorgan.com/disclosures.
© 2021 JPMorgan Chase & Co. All rights reserved.