
Key takeaways
- Global M&A volume is up 26% year to date to roughly $4.4 trillion, even after a 33% quarter-over-quarter pullback in the third quarter.
- A nearly $4 trillion backlog of sponsor-owned companies and a generational ownership transfer are expanding the pool of sellers.
- Government support is drawing capital into strategic sectors. With the 10 largest firms now making up roughly 38% of the S&P 500 in terms of market cap, subscale players face pressure to combine.
Despite relative softness in the M&A market in the third quarter of 2026, activity levels year to date remain elevated. Total volume is up 26% compared with the same time period in 2025, with a 22% jump in the number of deals valued above $10 billion.
J.P. Morgan expects continued momentum for a broader M&A cycle. In the latest M&A report, we explore four forces shaping the market heading into the end of the year.
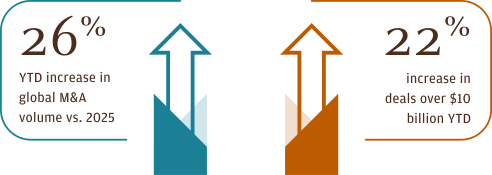
Infographic showing year-to-date M&A activity: 26% increase in global M&A volume versus 2025, and 22% increase in deals over $10 billion year-to-date, illustrated with teal and orange upward arrows.
AI adoption creates urgency across industries
AI has moved from concept to execution, becoming the central driver of deals and capital formation in 2026. Hyperscalers alone are expected to spend $650 billion on capex this year, and the figure is projected to exceed $1 trillion in 2027.
The gap between leaders and laggards is widening. Just 20% of organizations capture roughly 75% of AI’s economic value. Rising cybersecurity threats add urgency. The result is dealmaking that extends well beyond conventional acquisitions.
Companies are securing critical inputs such as compute and power through contracts and partnerships, buying differentiated capabilities like proprietary data and talent, and repositioning exposed portfolios through carve-outs and mergers. Minority investments and partnerships lead the way: AI-driven deals made up 54% of minority stake sales in the first eight months of 2026.
For subscale companies, the rising cost of competing could make a sale or merger with a scaled operator increasingly attractive, accelerating future M&A deal flow.
Private company dynamics deepen the pool of sellers
Roughly 6 million U.S. small and midsized businesses face ownership transitions by 2035 as founders retire, putting about $5 trillion in enterprise value in play. Simultaneously, sponsors are under pressure to return capital as 2026 marks the fourth straight year of below-normal sponsor liquidity. Around 32,000 portfolio companies worth roughly $4 trillion sit unsold in the U.S., and implied holding periods have stretched to seven years versus the historical average of five.
With a near-record $2 trillion in dry powder waiting to be deployed, the conditions are in place for a high-velocity M&A cycle. Sponsors are increasingly turning to structured exits including continuation vehicles, minority stake sales and net asset value financing.
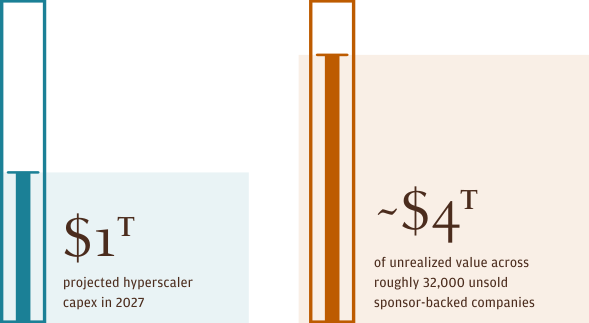
Infographic highlighting two figures: $1T projected hyperscaler capital expenditures in 2027, and approximately $4T of unrealized value across roughly 32,000 unsold sponsor-backed companies.
Strategic industry alignment opens new frontiers
Government policy is steering capital toward strategic sectors — defense, shipbuilding, bioscience, energy, semiconductors and next-generation networks — by working to lower investment risk.
Shipbuilding is one such example. The White House’s February 2026 maritime action plan calls for rebuilding U.S. commercial and defense shipbuilding, including encouraging partner countries to invest in domestic shipbuilding. The plan includes financing support, tax incentives and public-private partnerships. The U.S. is encouraging partner countries to invest in domestic shipbuilding; as a result, South Korea has committed $150 billion to the effort
Similarly, strategic alignment on 6G has spurred policy coordination between the U.S. and 25 other nations representing about 55% of global GDP. Members of the group have signed a pact to coordinate rollout, with standards and trials expected between 2027 and 2029. The pact aligns points of contact between nations as the 6G buildout progresses, encourages both industry and academia engagement, and aims to strengthen both supply-chain transparency and security standards on the road to commercial deployment of next-generation networks.
The bigger M&A tailwind may be the knock-on effect: large strategics applying their competitive advantages to a broader opportunity set, from automakers moving into defense to industrials expanding into software.
Markets reward scale
Investors continue to reward scale. Market value is concentrating in a handful of the largest companies, where increased scale and higher growth are translating into near multi-decade-high valuation premiums and multiple spreads.
Valuation premiums are near all-time highs, and they show up across both company size and geography. Within the U.S., the median S&P 500 company trades at 12.6x EV/EBITDA, versus 10.4x for the small-cap S&P 600. In Europe, multiples are lower: large caps on the STOXX 200 trade at 11.0x and the FTSE 100 at 8.7x. The U.K.'s mid-cap FTSE 250 trades at just 6.6x, roughly half the S&P 500 multiple. Growth earns a premium too: the gap between high- and low-growth firms is 7.9 turns on the S&P 500, compared with 6.2 on the STOXX 600.
These gaps cut two ways. Scaled acquirers, especially in the U.S., have a highly valued currency to pursue larger deals, including cross-border targets that look inexpensive by comparison. Meanwhile, subscale and lower-valued companies face mounting pressure to combine to close the gap.
Looking forward: M&A growth delayed, not derailed
Geopolitical turmoil, higher oil prices, persistent inflation and rising interest rates may delay some transactions and widen valuation gaps. But these factors don’t change the structural forces driving the cycle.
AI will continue to drive acquisitions, partnerships and capability add-ons across every industry. Sponsor backlogs and the ownership transfer wave will broaden private M&A, while strategic activity will likely increase in policy-driven critical sectors. Large strategics that paused activity in the third quarter represent pent-up demand that could re-emerge as headwinds subside.
Related insights
-

Banking
AI, defense and IPOs drive industrial innovation
June 30, 2026
Rapid advances in artificial intelligence, rising global defense budgets and shifting investment patterns are transforming industries.
-

Banking
2026 Global M&A Mid-Year Outlook
July 15, 2026
Remarkable activity amid complexity
-

Banking
Venture capital remains concentrated in AI and mega-rounds
October 08, 2026
AI captured 80%+ of venture capital through Q3 2026 while many startups face selective funding. Ginger Chambless and J.P. Morgan experts share insights on the bifurcated fundraising market.