---------------------------------------
Summary of findings
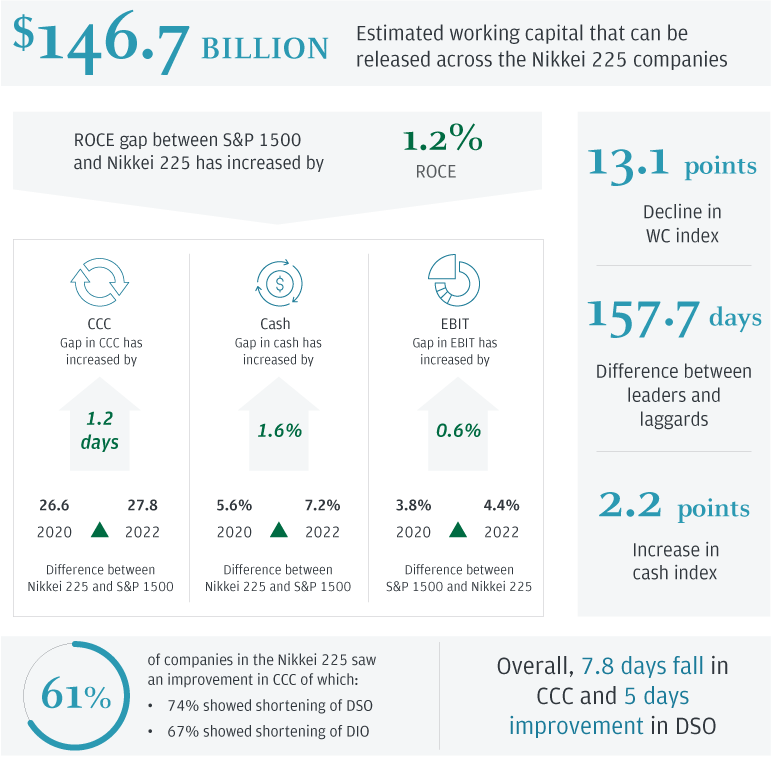
$146.7 billion - Estimated working capital that can be released across the Nikkei 225 companies
ROCE gap between S&P 1500 and Nikkei 225 has increased by 1.2% ROCE
CCC ROCE gap between S&P 1500 and Nikkei 225 has increased by 1.2 days
Difference between Nikkei 225 and S&P 1500 - 27.8 in year 2022 increased from 26.6 in year 2020
Cash gap in cash has increased by 1.6%
Difference between Nikkei 225 and S&P 1500 – 7.2% in year 2022 increased from 7.2% in year 2020
EBIT gap in EBIT has increased by 0.6%
Difference between S&P 1500 and Nikkei 225 – 4.4% in year 202 increased from 3.8% in year 2020
13.1 points - decline in WC Index
157.7 days - Difference between leaders and laggards
2.2 points - Increase in cash index
61% of companies in the Nikkei 225 saw an improvement in CCC of which:
- 74% showed shortening of DSO
- 67% showed shortening of DIO
Overall, 7.8 days fall in CCC and 5 days improvement in DSO
*****
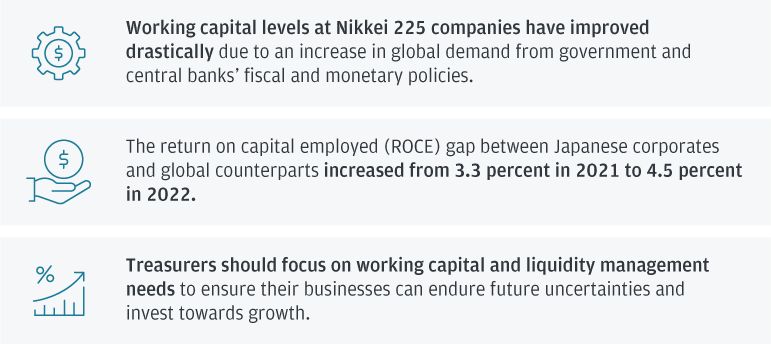
Working capital levels at Nikkei 225 companies have improved drastically due to an increase in global demand from government and central banks’ fiscal and monetary policies.
The return on capital employed (ROCE) gap between Japanese corporates and global counterparts increased from 3.3 percent in 2021 to 4.5 percent in 2022.
Treasurers should focus on working capital and liquidity management needs to ensure their businesses can endure future uncertainties and invest towards growth.
Cash Conversion Cycle (CCC) advancement
Japanese corporates experienced improved CCC by 7.8 days due to global demand pick-up
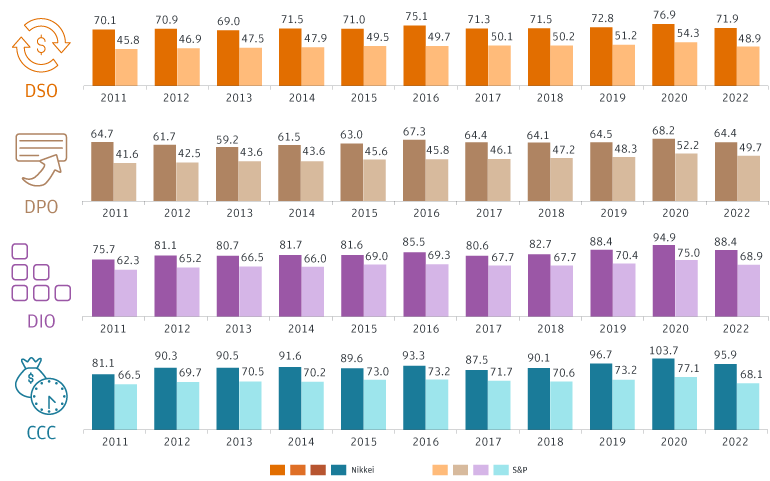
Japanese corporates witnessed an improvement in overall CCC by 7.8 days due to global demand pick-up.
DSO declined by 5 days driven by a recovery in demand and faster collections as companies could bargain for better terms for their customers.
After the rise in DPO in FY2020, DPO levels in FY2021 saw a decline of 3.8 days.
DIO levels exhibited a drop by 6.5 days for Nikkei 225 companies, driven by higher-than-expected consumer demand coupled with supply chain disruptions. The CCC gap between Nikkei 225 and S&P 1500 companies has largely remained flat, with a slight improvement of 1.2 days on an average basis.
Japanese corporates see widening of gap in ROCE compared to global counterparts
Increase in demand caused the ROCE of Nikkei 225 companies to improve, however, the ROCE for average global companies has grown significantly higher – creating an ideal opportunity for Japanese corporates to improve their capital utilization and free up cash to invest more towards capital expenditure that can help companies grow
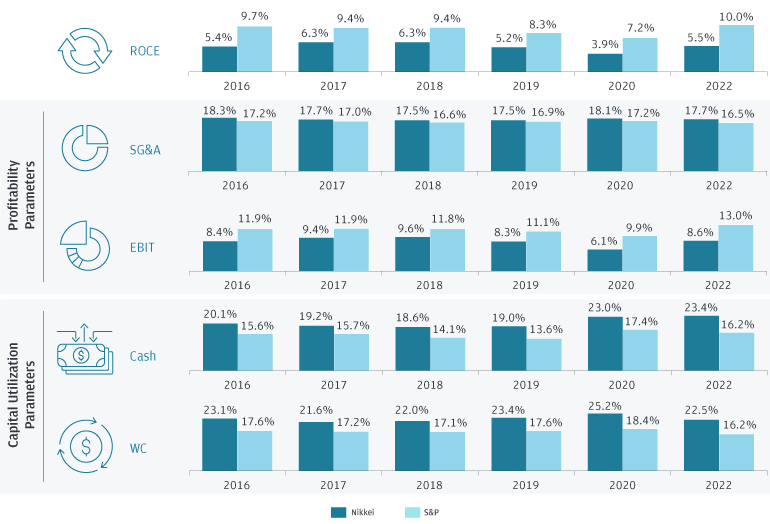
ROCE for an average S&P 1500 company has grown significantly higher.
The difference between earnings before interest and taxes (EBIT) margins of an average S&P 1500 and a Nikkei 225 company has increased in 2022 to 4.4% from 3.8% in 2020.
While the working capital/sales levels gap has marginally narrowed by 0.5% in 2022, it is still significantly higher for an average Nikkei 225 company at 22.5% as compared to just 16.2% for an average S&P 1500 company. While cash/sales levels at S&P 1500 companies dropped by 1.2%, cash levels increased for Nikkei 225 companies by 0.4%, widening the gap substantially to 7.2% as of 2022.
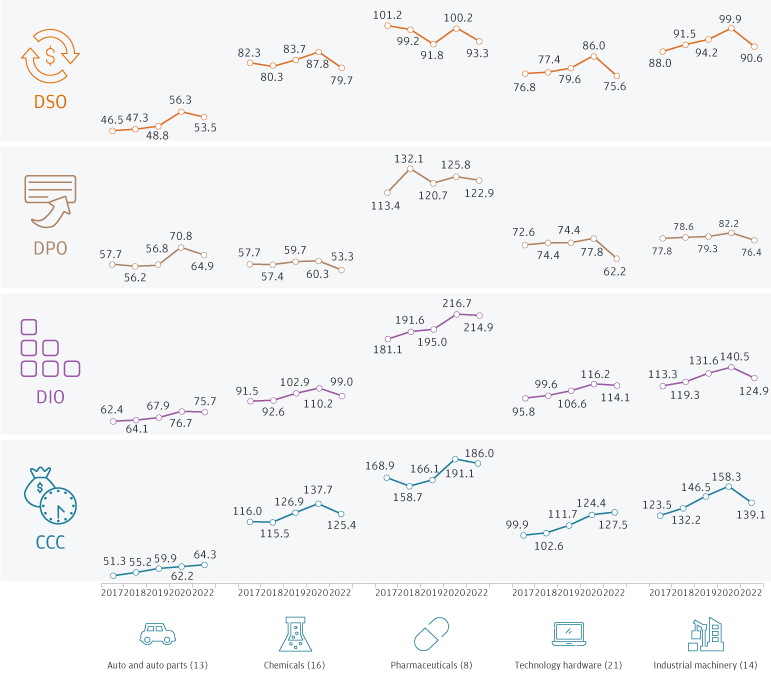
Industry insights across the Cash Conversion Cycle
Cash Conversion Cycle across five key industries increased over the span of six years, while Days Sales Outstanding (DSO), Days Inventory Outstanding (DIO) and Days Payable Outstanding (DPO) levels were mixed overall.
-

Auto and auto parts
• DPO declined by 5.9 days, more than compensating for the decline in DSO.
• DIO levels fell down by only 1 day despite high demand.
-

Chemicals
• DIO declined by 11.2 days due to strong demand. DSO levels fell by 8.1 points, closer to pre-pandemic levels.
-

Pharmaceuticals
• The pharmaceutical industry experienced overall improvement in working capital levels.
-

Technology hardware
• DPO saw a sharp decline by 15.6 days that offset a substantial decline of 10.4 days. The technology hardware industry faced a decline in DIO levels of only 2.1 days.
-

Industrial machinery
• Japan, being one of the global leaders in manufacturing machinery, saw inventory levels for the industry decline by 15.6 days while DSO improved by 9.3 days.
Cash Conversion Cycle across five key industries increased over the span of six years, while Days Sales Outstanding (DSO), Days Inventory Outstanding (DIO) and Days Payable Outstanding (DPO) levels were mixed overall.
Auto & auto parts:
- DPO declined by 5.9 days, more than compensating for the decline in DSO
- DIO levels fell down by only 1 day despite high demand
Chemicals:
- DIO declined by 11.2 days due to strong demand. DSO levels fell by 8.1 points, closer to pre-pandemic levels
Pharmaceuticals:
- The pharmaceutical industry experienced overall improvement in working capital levels
Technology hardware:
- DPO saw a sharp decline by 15.6 days that offset a substantial decline of 10.4 days. The technology hardware industry faced a decline in DIO levels of only 2.1 days
Industrial machinery:
- Japan, being one of the global leaders in manufacturing machinery, saw inventory levels for the industry decline by 15.6 days while DSO improved by 9.3 days
Future growth for supply chain ecosystems
How companies operate and make decisions in the future will influence the supply chain ecosystems – materially impacting corporates’ working capital as supply chains adjust to create supplier diversification that shift with emerging trends.
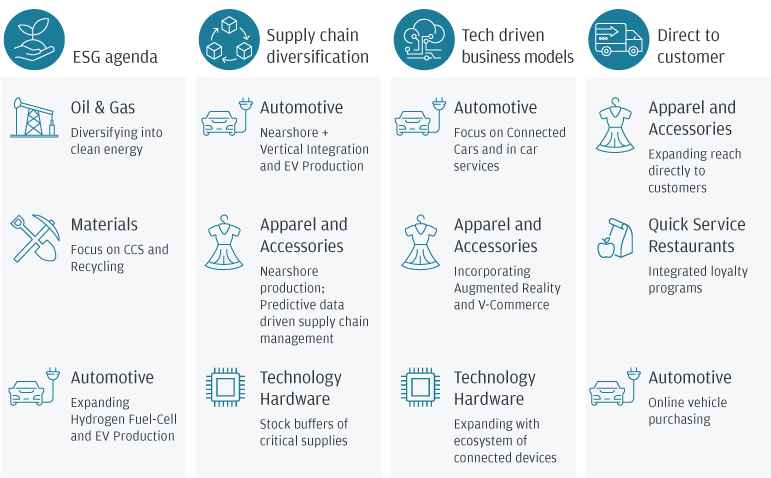
ESG Agenda
Oil & Gas - Diversifying into clean energy
Materials - Focus on CCS and Recycling
Automotive - Expanding Hydrogen Fuel-Cell & EV Production
Supply Chain Diversification
Automotive - Nearshore + Vertical Integration
Apparel and Accessories - Nearshore production; Predictive data driven supply chain management
Technology Hardware - Stock buffers of critical supplies
Tech driven business models
Automotive - Focus on Connected Cars and in car services
Apparel and Accessories - Incorporating Augmented Reality and V-Commerce
Technology Hardware - Expanding with ecosystem of connected devices
Direct to customer
Apparel and Accessories - Expanding reach directly to customers
Quick Service Restaurants - Integrated loyalty programs
Automotive - Online vehicle purchasing
To learn more about how we can support your business, please contact your J.P. Morgan representative.