China emerged as one of the first economies to recover from the pandemic. However, the global operating environment presented multi-faceted challenges in 2021 including lockdown impacts, reduced domestic demand growth, subsiding policy support, and reduced investment and export demand given strong economic recovery. As a result, the Working Capital Index deteriorated in 2021. The Cash Index improved with a similar trajectory to S&P 1500 companies as investment activities picked up and companies looked to sustain growth momentum through more aggressive cash deployment.
---------------------------------------
Summary of findings
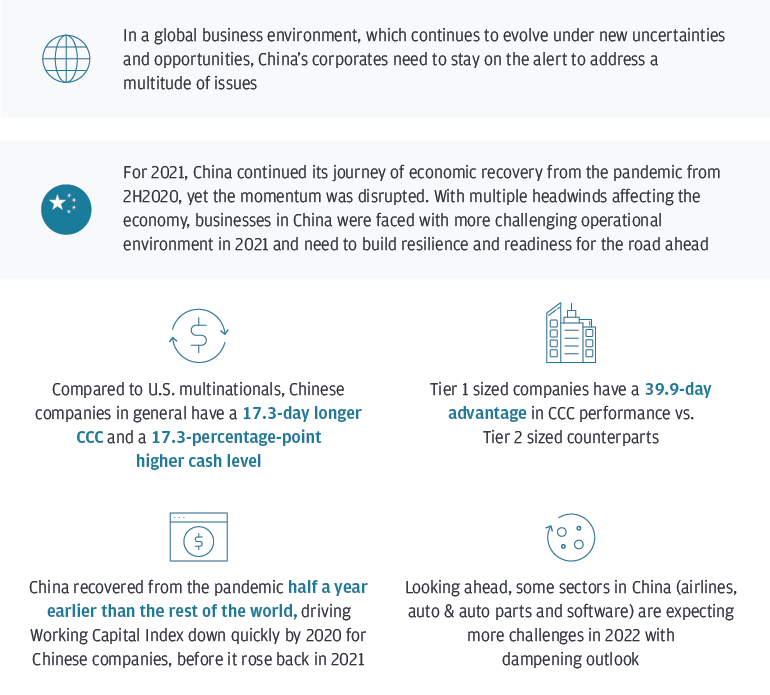
In a global business environment, which continues to evolve under new uncertainties and opportunities, China’s corporates need to stay on the alert to address a multitude of issues
For 2021, China continued its journey of economic recovery from the pandemic from 2H2020, yet the momentum was disrupted. With multiple headwinds affecting the economy, businesses in China were faced with more challenging operational environment in 2021 and need to build resilience and readiness for the road ahead
- Compared to U.S. multinationals, Chinese companies in general have a 17.3-day longer CCC and a 17.3-percentage-point higher cash level
- Tier 1 sized companies have a 39.9-day advantage in CCC performance vs. Tier 2 sized counterparts
- China recovered from the pandemic half a year earlier than the rest of the world, driving Working Capital Index down quickly by 2020 for Chinese companies, before it rose back in 2021
- Looking ahead, some sectors in China (airlines, auto & auto parts and software) are expecting more challenges in 2022 with dampening outlook
Working capital and cash conversion cycle takeaways
The working capital index deteriorated by 4 points and returned to pre-pandemic levels for four reasons:
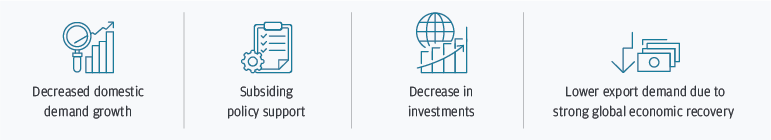
- Decreased domestic demand growth
- Subsiding policy support
- Decrease in Investments
- Lower export demand due to strong global economic recovery
The Cash Index improved 8 points as companies more strategically deployed cash:

Investments were a particular area where cash deployment increased
The Cash Conversion Cycle declined by 2 and is significantly higher for Tier 2 sized companies
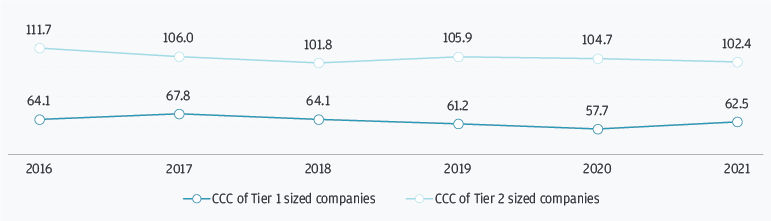
This graph displays the CCC of Tier 1 sized companies and the CCC of Tier 2 sized companies from years 2016 to 2021.
For CCC of Tier 1 sized companies: 64.1 in 2016, 67.8 in 2017, 64.1 in 2018, 61.2 in 2019, 57.7 in 2020, 62.5 in 2021.
For CCC of Tier 2 sized companies: 111.7 in 2016, 106.0 in 2017, 101.8 in 2018, 105.9 in 2019, 104.7 in 2020, 102.4 in 2021.
Chinese companies generally hold higher cash levels than their U.S. counterparts
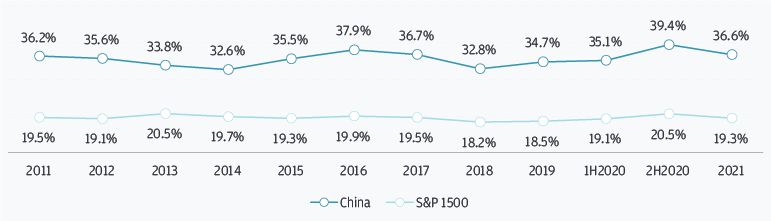
This graph displays cash levels by percent for China and for S and P 1500 from years 2011 to 2021.
For China: 36.2 in 2011, 35.6 in 2012, 33.8 in 2013, 32.6 in 2014, 35.5 in 2015, 37.9 in 2016, 36.7 in 2017, 32.8 in 2018, 34.7 in 2019, 35.1 in first half of 2020, 39.4 in second half of 2020, 36.6 in 2021.
For S and P 1500: 19.5 in 2011, 19.1 in 2012, 20.5 in 2013, 19.7 in 2014, 19.3 in 2015, 19.9 in 2016, 19.5 in 2017, 18.2 in 2018, 18.5 in 2019, 19.1 in first half of 2020, 20.5 in second half of 2020, 19.3 in 2021.
Industry improvement opportunities
-

eCommerce
Raise operational efficiencies to keep their competitive edge -

Oil and Gas downstream
Prepare business models for a world with greater global clean energy consciousness -

Pharmaceuticals
Optimize financing resources given sophisticated operating environment -

Auto and auto parts
Focus on internal funding and WC structure optimization to prepare for liquidity challenges
To learn more about how we can support your business, please contact your J.P. Morgan representative.