12 min read
Key takeaways
- Higher-value fan spending concentrates farther out, not at the gates. The 3–5 mile band around a major venue captured 27.2% of total off-venue spend, the single largest share of any distance band, while the zone immediately outside the gates had the lowest average ticket size
- International visitors do not just attend, they spend. Cardholders from 155 countries transacted in merchant locations during a single tournament window. Hotel and dining categories saw the clearest event-driven lift, rising 5.6 and 5.0 percentage points above pre-tournament levels
- Peak commercial demand may not fall on match day, and merchants who plan only for kickoff risk missing the biggest opportunity. Food and restaurant transactions peaked at 75% above baseline on a midweek day with no scheduled match
Introduction
An upcoming global soccer event is expected to bring national teams from across the globe, millions of international visitors and one of the largest concentrations of consumer spending ever seen across a set of U.S. host cities. For merchants, the opportunity is real and time-bound. But capturing it may require more than simply being open on match days.
J.P. Morgan Customer Insights analyzed payment card transaction data from major sporting and entertainment events across U.S. cities in 2025 and 2026 to surface trends in how fans behave, spend and prioritize across an event window, based on their personas and demographic characteristics. What the data reveals may challenge some common assumptions.
The opportunity is often not where merchants expect it, the demand may not arrive when they assume it will and the customers who spend the most may not be the ones closest to the gates. Merchants who understand these patterns in advance can position themselves to capture more of the opportunity.
Title card for “Winning the World Cup of Commerce.” Large headline reads, “The biggest opportunity may not be at the gates,” with subhead “What merchants need to know before the upcoming global soccer event.” Body copy states that J.P. Morgan payment data reveals where, when, and how fans actually spend during major sporting events. Footer says “Powered by J.P. Morgan Customer Insights.” Visual includes a stylized, multi-colored soccer ball graphic on the right.
The value is not always closest to the venue
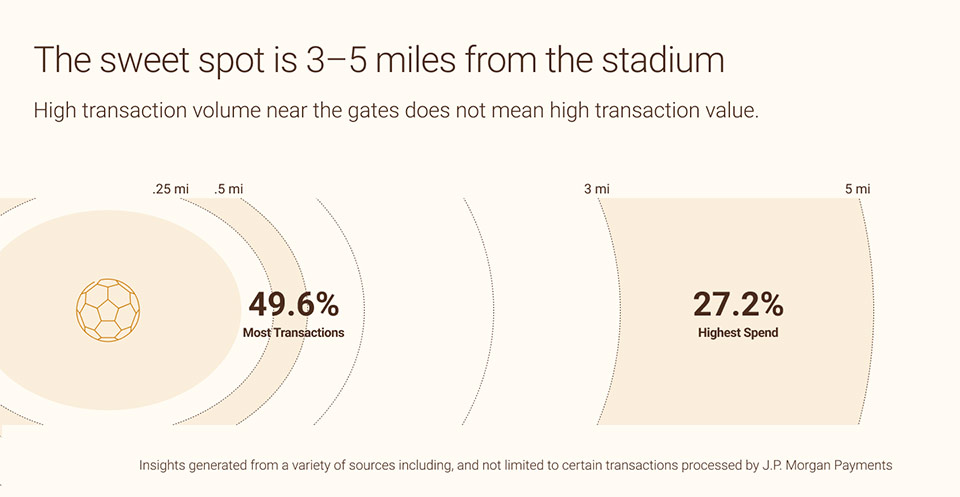
Slide with headline “The sweet spot is 3–5 miles from the stadium” and subhead “High transaction volume near the gates does not mean high transaction value.” A stadium icon sits at left with concentric distance rings labeled (e.g.,.25 mi,.5 mi, 3 mi, 5 mi). Callouts show “49.6% Most Transactions” near the closer rings and “27.2% Highest Spend” in the 3–5 mile band. Footer notes insights are generated from various sources including, and not limited to, certain transactions processed by J.P. Morgan Payments.
Data insight: Analysis of card-present transactions around major sporting and entertainment events found that the 3–5 mile distance band captured 27.2% of total off-venue spend, the single largest share of any band. By contrast, the band immediately surrounding the venue accounted for 49.6% of all transactions but had the lowest average ticket index at 49, reflecting the concentration of quick-service food and transit purchases near the gates. The highest average ticket size was observed at 1–2 miles from the venue, where hotels, full-service restaurants and bars command higher per-transaction values.
Consider: Merchants located within 1-5 miles of the stadium may be well positioned to capture premium event-adjacent spend, even without direct stadium proximity. For merchants closer to the gates, the data suggests that volume can be high while average transaction values may be lower, which can inform decisions on product mix, staffing levels and promotional strategy during match windows. For operations and marketing teams, this is an opportunity to design targeted promotions and fan traffic initiatives that can draw attendees away from the immediate venue footprint and into surrounding commercial corridors.
International visitors reshape local commerce
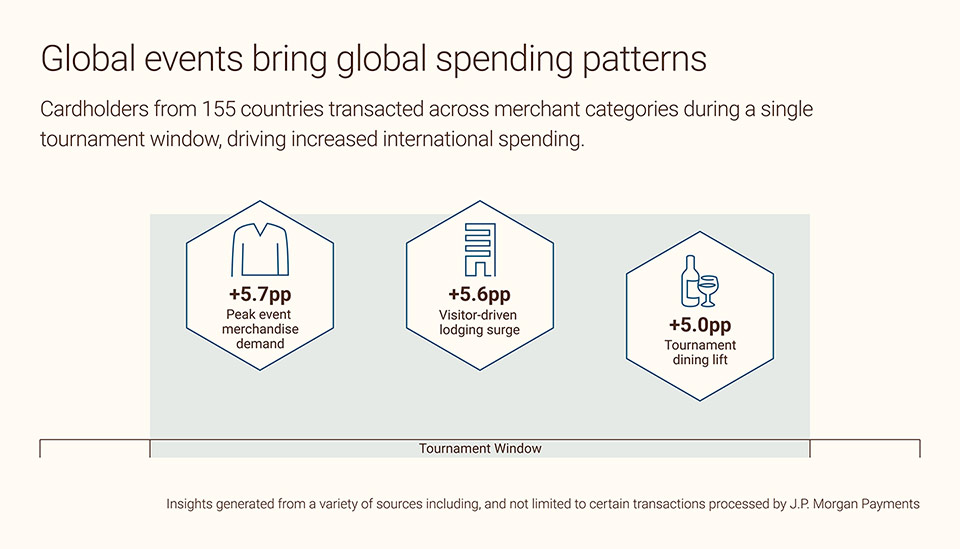
Slide titled “Global events bring global spending patterns.” Supporting text says cardholders from 155 countries transacted across merchant categories during a single tournament window, increasing international spending. Three icon tiles highlight: “+5.7pp Peak event merchandise demand,” “+5.6pp Visitor-driven lodging surge,” and “+5.0pp Tournament dining lift,” above a bracket labeled “Tournament Window.” Footer notes insights are generated from various sources including, and not limited to, certain transactions processed by J.P. Morgan Payments.
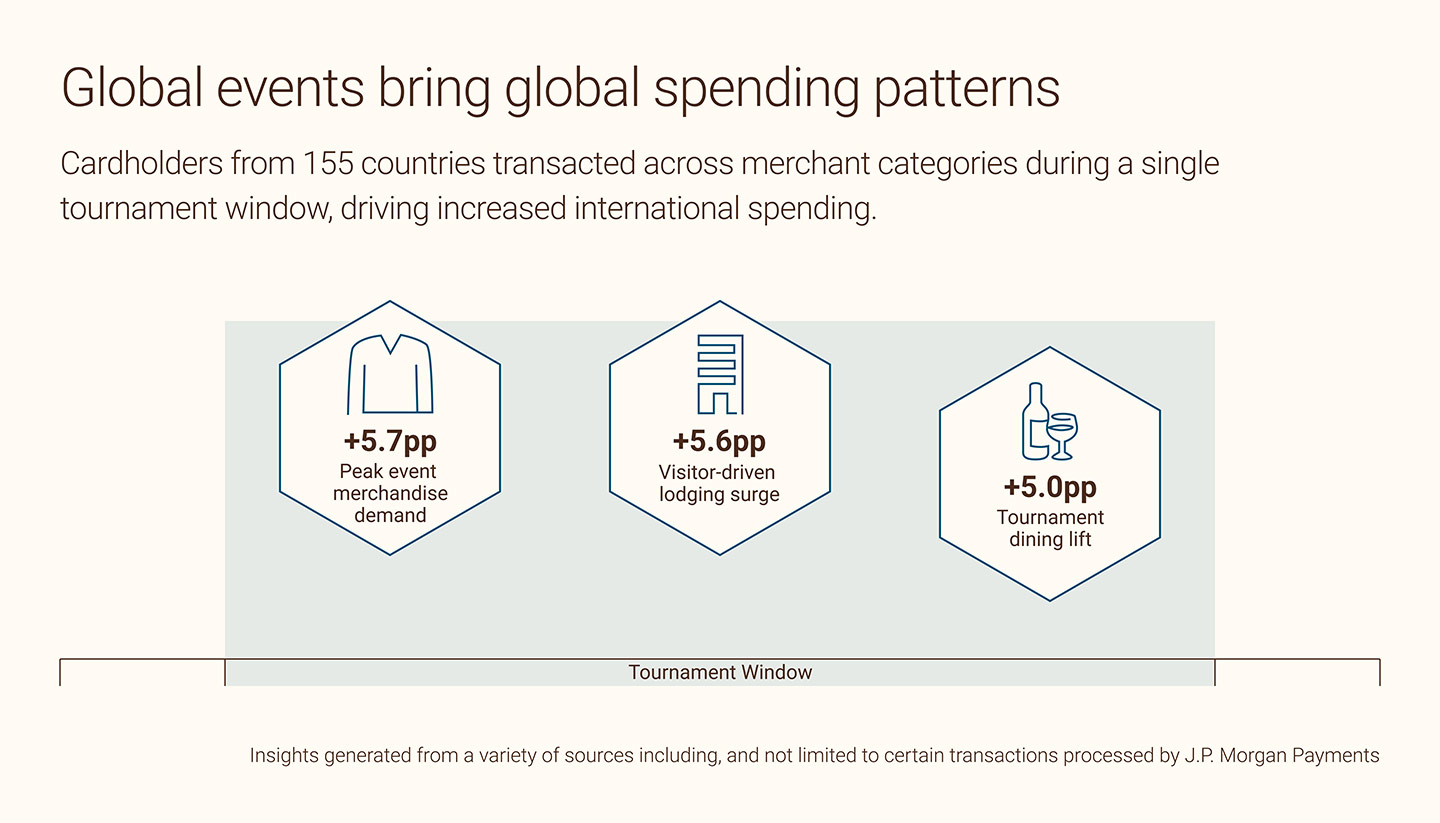
Data insight: Data from major tournament events shows that international card transactions increased their share of total activity across every industry analyzed. Hotel and dining categories saw the sharpest event-driven lift, rising 5.6 and 5.0 percentage points, respectively, above pre-tournament levels. Transactions from cardholders across 155 countries were recorded in tourist-core merchant locations, with Latin American and European markets among the top source markets by transaction volume.
Consider: For this event, the mix of international visitors is likely to vary by host city depending on which national teams are playing nearby. Merchants who understand which fan bases are expected in their market can use that intelligence to design experiences that may attract international visitors, from culturally inspired menu items and limited-time product offerings that reflect top visitor markets, to multilingual signage, promotions and in-store communications in the languages most relevant to expected visitor segments. Ensuring payment infrastructure can handle a broad range of international cards can also help reduce friction at the point of purchase during peak periods.
Timing matters across the full event cycle
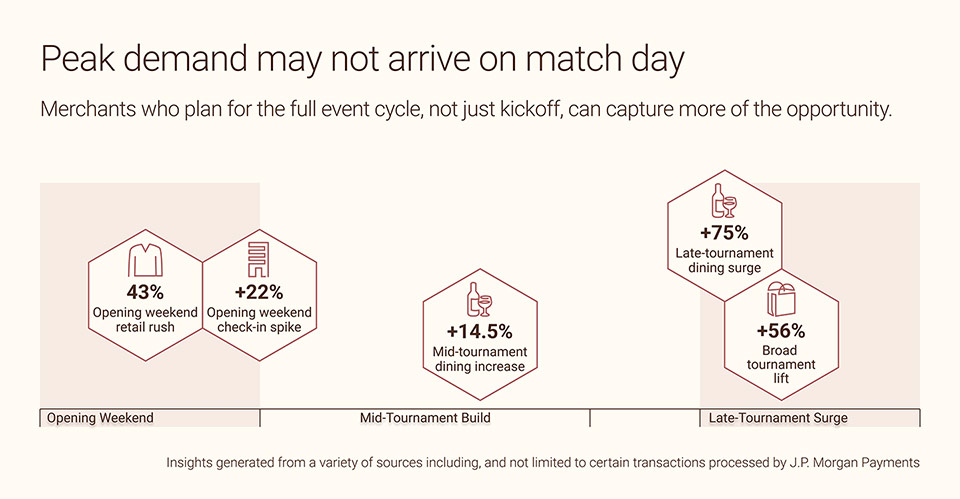
Slide titled “Peak demand may not arrive on match day,” with a line noting that merchants who plan for the full event cycle—not just kickoff—can capture more opportunity. A timeline shows three phases: “Opening Weekend,” “Mid-Tournament Build,” and “Late-Tournament Surge.” Hexagon callouts show “43% Opening weekend retail rush,” “+22% Opening weekend check-in spike,” “+14.5% Mid-tournament dining increase,” “+75% Late-tournament dining surge,” and “+56% Broad tournament lift.” Footer notes insights are generated from various sources including, and not limited to, certain transactions processed by J.P. Morgan Payments.
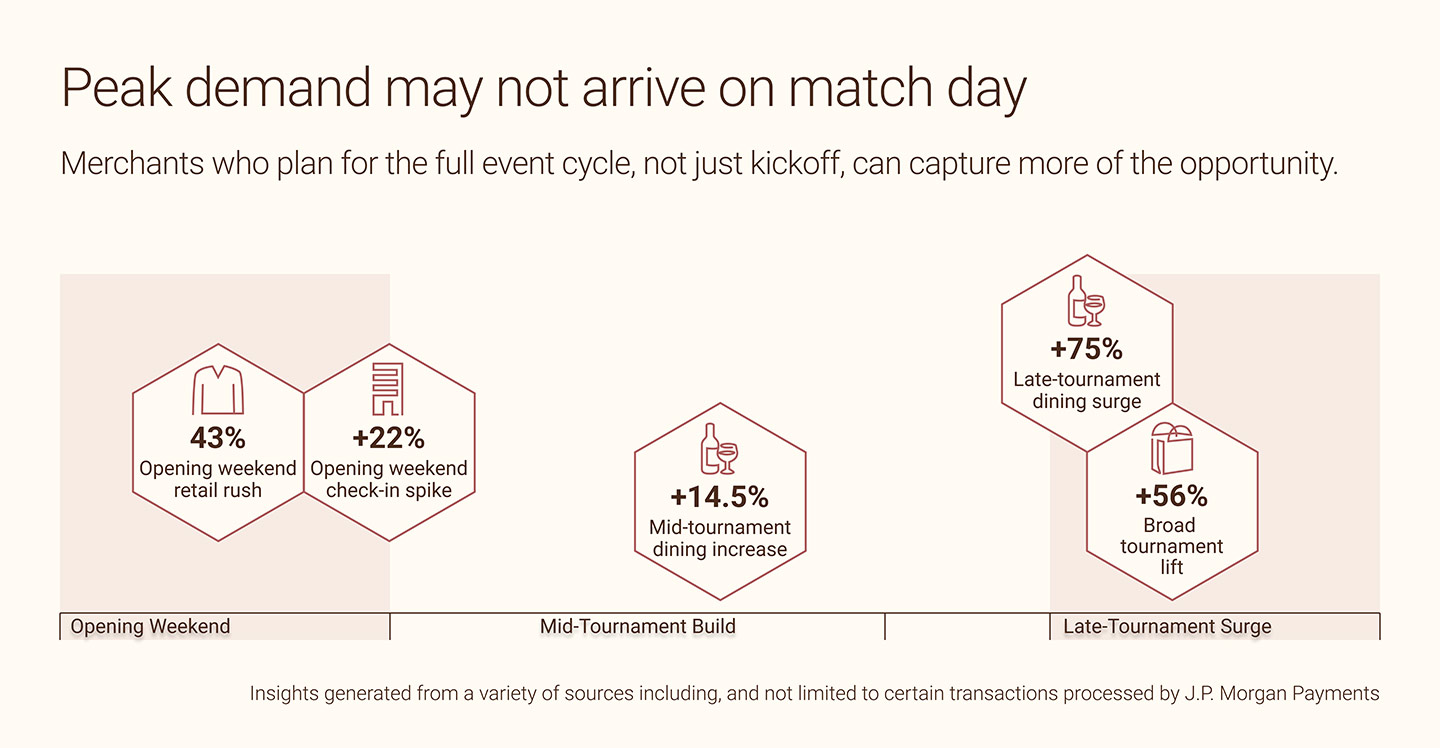
Data insight: Data from major tournament events shows that spending does not peak uniformly on match days. Food and restaurant transactions averaged 14.5% above the pre-tournament daily baseline across the tournament window, but the single largest day ran 75% above baseline on a midweek day with no scheduled match. Hotels and lodging demand was front-loaded, with the opening weekend running approximately 22% above baseline as visitors checked in. Clothing transactions peaked on the first two tournament days before falling below average for the remainder of the window, consistent with a first-weekend arrival shopping pattern.
Consider: Rather than focusing solely on match days, merchants may want to plan for the full soccer event cycle. Hotels and accommodation-adjacent businesses may benefit from prioritizing readiness during the arrival period. Restaurants and bars may see their strongest demand build later in a tournament window. Retailers selling fan apparel and gear may find their peak opportunity in the days before and immediately after the tournament opens. Operations and marketing teams may want to align staffing schedules, inventory replenishment and promotional campaigns to these category-specific timing patterns, rather than treating the entire event window as a single uniform demand spike.
Generational behavior varies by distance
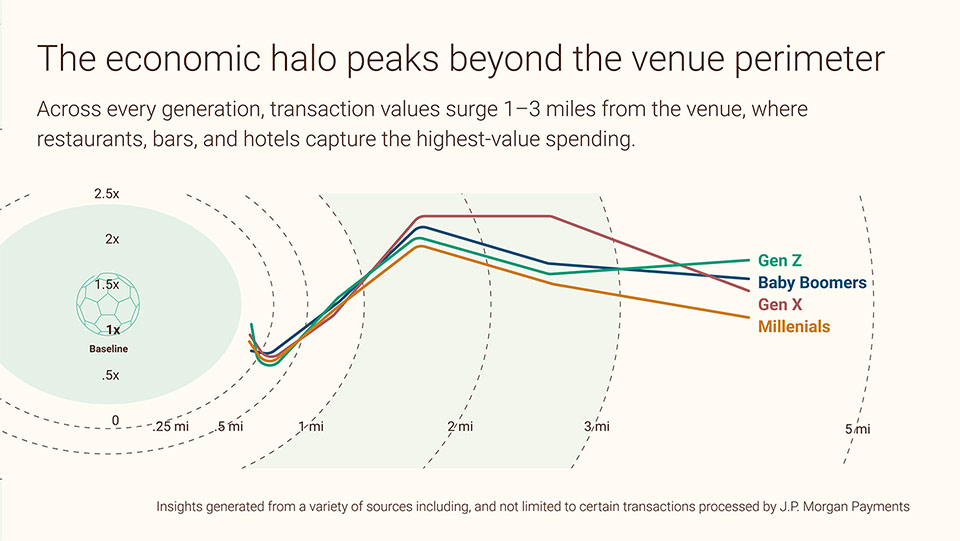
Slide titled “The economic halo peaks beyond the venue perimeter.” Text explains that across every generation, transaction values surge 1–3 miles from the venue where restaurants, bars, and hotels capture the highest-value spending. A line chart plots spend versus distance from the venue (distance markers from near-zero to 5 miles), with separate lines labeled Gen Z, Baby Boomers, Gen X, and Millennials; the lines rise and peak around the 1–3 mile range. A small “Baseline” stadium icon appears at left with a vertical scale (e.g., 0.5x to 2.5x). Footer notes insights are generated from various sources including, and not limited to, certain transactions processed by J.P. Morgan Payments.
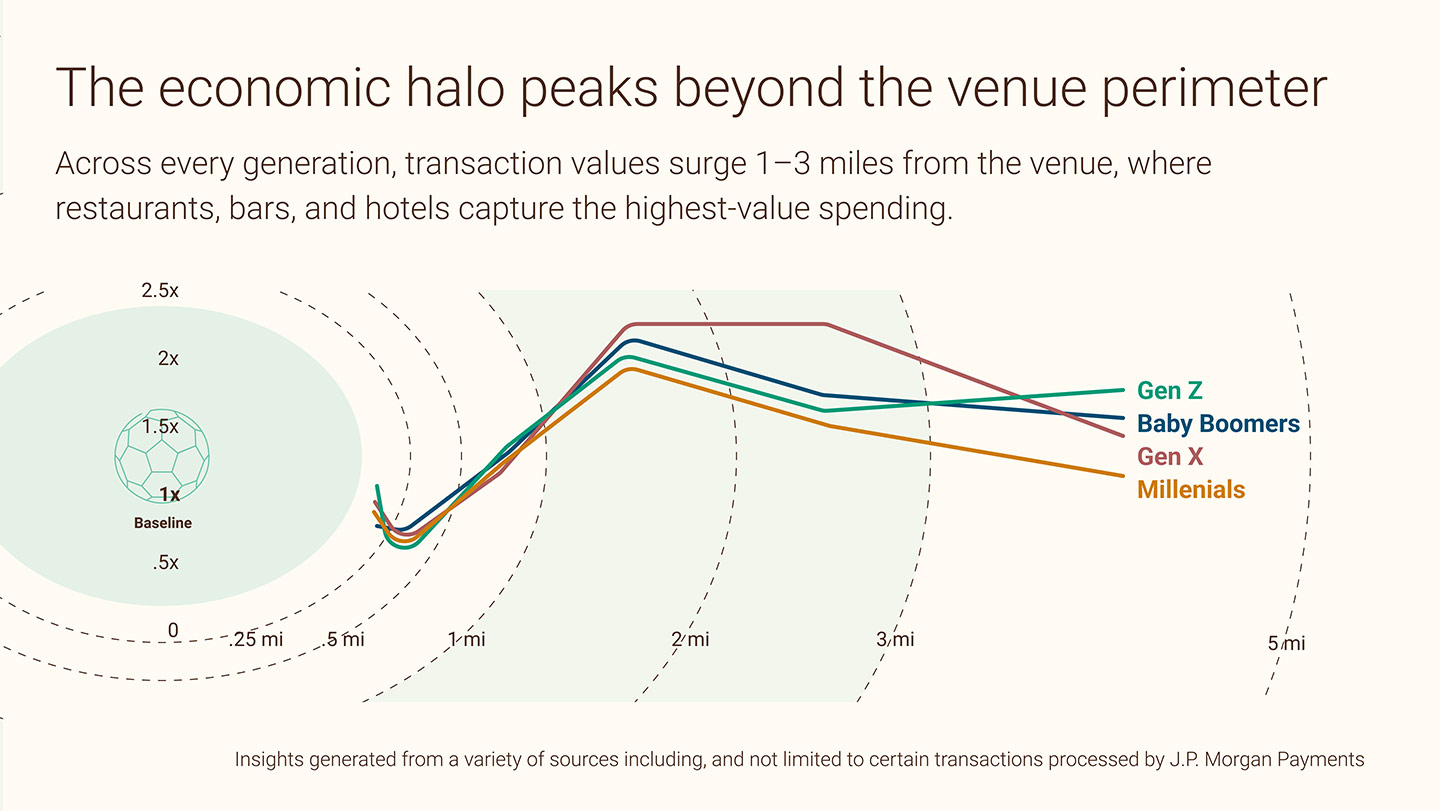
Data insight: Analysis of off-venue spending by age cohort found that all generations follow a consistent pattern: average ticket size is lowest in the band closest to the venue, then rises substantially at 1–2 miles, where sit-down restaurants, bars and hotels concentrate. Gen X reached an average ticket index of 208 at 1–2 miles from the venue and 209 at 2–3 miles, roughly double the overall off-venue average. Baby Boomers indexed at just 66 immediately near the venue but rebounded to 202 at 1–2 miles, consistent with a preference for full-service dining and lodging over quick-service options. Gen Z was the only generation to index above the baseline near the venue, at 106 within a quarter mile, while also reaching 192 at 1–2 miles. These findings are directional; approximately half of the cards in the dataset lacked a demographic match and were excluded from the generational analysis.
Consider: Merchants within the 1–3 mile radius around these global soccer event venues may find that their highest-value customers are Gen X and Baby Boomer visitors, whose spending patterns suggest a strong preference for destination dining and lodging over convenience purchases. Younger fans represent a meaningful opportunity closer to the venue. Operations and marketing teams can use generational spending patterns to help tailor loyalty offers, channel selection, menu or product mix, and staffing formats to the audience most likely to convert at their specific location, turning event foot traffic into targeted customer acquisition.
Looking ahead
The global soccer event is poised to generate a concentrated, citywide commercial opportunity across every U.S. host market. The merchants best positioned to capture it will be those who plan not just for match day, but for the full arc of event-driven demand, from the arrival weekend through the final whistle.
J.P. Morgan Customer Insights can help merchants translate payment data into practical planning intelligence, including customer proximity to purchase preferences, the makeup of local versus tourist purchasing and customer demographic and behavioral personas. For businesses preparing for one of the largest sporting events ever hosted on U.S. soil, data-led planning can help convert a short-term surge in foot traffic into lasting customer relationships and measurable revenue growth.
See what the data reveals before the tournament begins
Learn more about our Customer Insights Solution and how we can help you navigate data.
References
Data sourced by J.P. Morgan Customer Insights from analysis of payment card transactions around major sporting and entertainment events across U.S. cities, including large-scale soccer tournaments and entertainment venue events. All figures are derived from settled card-present transactions in USD. Generational analysis is directional; approximately 50% of cards lacked a demographic match and were excluded. Findings reflect observed patterns across specific event windows and geographies and are intended as indicative, not universally predictive.
Any mentions of third-party trademarks, brand names, products and services are for referential purposes only and any mention thereof is not meant to imply any sponsorship, endorsement, or affiliation.
Disclaimer
© 2026 JPMorgan Chase & Co. All rights reserved. JPMorgan Chase Bank, N.A. Member FDIC. Deposits held in non-U.S. branches are not FDIC insured. Non-deposit products are not FDIC insured. The statements herein are confidential and proprietary and not intended to be legally binding. Not all products and services are available in all geographical areas. Visit jpmorgan.com/paymentsdisclosure for further disclosures and disclaimers related to this content.