Abstract, stylized data landscape with flowing gold and white lines and vertical bar-like markers on a dark background, suggesting financial or analytics trends.

Key takeaways

  • ETFs offer investors various benefits, including portfolio diversification, intraday liquidity and lower costs compared with mutual funds.
  • Total ETF assets under management (AUM) amounted to around $22.1 trillion globally as of end-April 2026.
  • Active ETF products continue to scale rapidly, representing more than 60% of new launches in each of the past six years.

ETFs have grown from a niche offering in the 1990s to one of the most popular investment vehicles available today. Embraced by both retail and institutional investors alike, they combine the broad diversification of mutual funds with the flexibility of trading individual securities — making them a core building block of modern portfolios.

What is an ETF?

An ETF, or exchange-traded fund, is a portfolio of securities, commodities or other instruments that is traded on an exchange. Investors own a share of the ETF itself, which represents a fractional ownership interest in the portfolio of underlying securities.

There are many different types of ETFs, including:

  • Equity ETFs: These invest in shares of various companies, often tracking major indices such as the S&P 500.
  • Sector / thematic ETFs: A subset of equity ETFs, these focus on stocks grouped under a specific sector, secular trend or macroeconomic theme, such as healthcare, AI and ESG.
  • Fixed-income ETFs: These hold portfolios of fixed-income securities, such as government, corporate or municipal bonds, loans and mortgages.
  • Commodity ETFs: These track the price of commodities like gold, silver and oil.
  • Actively managed ETFs: While some ETFs are passive, meaning they track an index without active stock selection, others are managed by portfolio managers who buy and sell assets to pursue specific investment goals.

What is the history of ETFs?

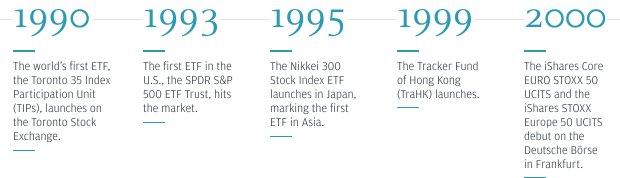
The first ETF was created in Canada in 1990, and the first U.S. ETF hit the market in 1993. By 2000, U.S. ETF offerings included funds tracking the S&P 500 and Dow Jones sectors, international MSCI indices, as well as major U.S. capitalization and style benchmarks.

ETFs soon took off across the globe, launching in Japan in 1995, Hong Kong in 1999 and Europe in 2000. The market then expanded rapidly over the following decade. “From 2001 to 2011, the number of ETFs listed globally increased from ~250 to ~3,700, registering an annualized growth rate of around 30%,” said Bram Kaplan, head of Americas Equity Derivatives Strategy at J.P. Morgan. “Since then, the pace of increase of the number of ETFs listed has slowed to 10% on average as the market matured.”  

Timeline highlighting early ETF milestones from 1990–2000: the first ETF launches in Canada (1990) and the U.S. (1993), Japan’s first ETF (1995), Hong Kong’s Tracker Fund launch (1999), and iShares STOXX Europe UCITS debuts in Frankfurt (2000).

What are the benefits of ETFs?

Thanks to their unique trading characteristics, ETFs can offer investors several benefits, including:

  • Portfolio diversification: ETFs enable investors to access up to thousands of securities across a range of markets, benchmarks and asset classes via a single security, providing instant portfolio diversification and reducing concentration risk.
  • Intraday liquidity: Unlike mutual funds, which are traded only once a day, ETFs can be bought and sold instantly at market prices during standard exchange hours.
  • Lower costs: Many ETFs are passive and do not require expensive research and portfolio managers. As such, they generally have lower ongoing management fees. ETFs also generally have lower distribution and servicing costs compared with mutual funds.
  • Tax efficiency: In the U.S., ETFs are often considered more tax-efficient than mutual funds due their ability to transfer securities “in-kind.” This can allow them to rebalance the portfolio and meet redemption requests without selling holdings, reducing capital gains distributions to investors in the fund.
  • Transparency: Most ETFs disclose a complete list of holdings daily (versus quarterly for mutual funds), which increases predictability and oversight.  

How are global ETF markets performing?

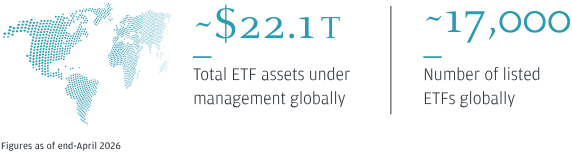
Global ETF markets continue to grow. According to J.P. Morgan Global Research, total ETF assets under management (AUM) amounted to around $22.1 trillion globally as of end-April 2026, up 43% from a year earlier. In addition, the number of listed ETFs globally has increased to nearly 17,000. 

Total ETF assets infographic

The U.S.-listed ETF industry has expanded considerably over the past few decades, both in product breadth and scale. As of end-April 2026, there were around 5,100 ETFs listed in the U.S., holding around $14.9 trillion in assets.

“New launches remain robust as providers address new investment themes, offer more granular exposures, expand coverage of the investable universe, broaden the range of structured outcomes and continue migrating actively managed strategies into the ETF wrapper,” Kaplan said.  

Europe has around 4,900 listed ETFs and ETCs (Exchange Traded Commodities) — debt instruments designed to track the performance of a specific physical commodity or commodity index. Together, these represent $3.75 trillion in assets, and most products are cross-listed on multiple European exchanges.

“International equity and fixed income ETFs are the largest segments, accounting for 49% and 20% of assets respectively,” Kaplan noted. Within domestic European equity exposures, broad-based ETFs represent around 13% of total market AUM, versus 7% in style-based funds and 5% in sector funds; commodity ETFs account for 7%. 

There are roughly 5,000 listed Asia Pacific ETFs, representing $2.7 trillion in AUM. Japan-focused equity ETFs remain the largest segment at around 28%, down slightly from 30% in 2025. China-focused funds have also lost some market share as state-backed entities streamline their portfolios. “Offsetting these declines, Korea- and U.S.-focused equity ETFs gained share over the past year, consistent with investor positioning in markets linked to the AI theme,” Kaplan said.

Elsewhere, non-equity ETFs (primarily fixed income) account for approximately 22% of Asia-Pacific ETF assets, while equity style, sector and international funds each represent around 5–10%. 

“New ETF launches in the U.S. remain robust as providers address new investment themes, offer more granular exposures, expand coverage of the investable universe, broaden the range of structured outcomes and continue migrating actively managed strategies into the ETF wrapper.”

What are the latest developments in ETF markets?

  • Active ETFs continue to scale rapidly: Active products have represented more than 60% of new ETF launches in each of the past six years. In the U.S., active ETFs now outnumber passive ETFs, with AUM growing around 80% year over year to $1.8 trillion. They are also a key focus for both issuers and investors in international markets such as EMEA, where AUM has roughly doubled year over year to $122 billion.
  • Options-based ETFs are surging: Options-based ETFs use options contracts (calls and puts) to pursue specific goals — most commonly generating income (yield) and reducing downside risk (hedging). Assets in U.S. options-based ETF strategies rose about 50% year over year to roughly $280 billion (as of mid-May 2026). Call overwriting funds, which sell call options to generate income, remain the largest segment. However, the fastest growth is in structured-outcome ETFs, which aim to deliver results similar to structured products.
  • The growth of levered ETFs: Levered ETFs, which use debt and financial derivatives to multiply the daily return of an underlying benchmark, have also grown in popularity. Over the past decade, AUM in U.S.-listed levered ETFs has increased nearly sixfold to around $175 billion in equities and over $190 billion across asset classes (as of mid-May 2026). Growth has also become increasingly concentrated in technology-linked exposures (including Nasdaq) and single-stock products.
  • Thematic ETFs are experiencing a revival: Thematic ETFs benefited early in the pandemic as investor demand rose for innovation- and digitalization-linked exposures. Many of these themes then underperformed materially in late 2021 through 2022 amid crowding and valuation compression, resulting in a prolonged lull in demand. However, they have rebounded over the past year, with themes linked to AI development and the related infrastructure buildout attracting meaningful inflows.

ETF trends to watch 

From automation to tokenization, learn more about other ETF trends reshaping the investment landscape.  

see trends


Related insights


This communication is provided for information purposes only. JPMorgan Chase & Co. or its affiliates and/or subsidiaries (collectively, J.P. Morgan) normally make a market and trade as principal in securities, other financial products and other asset classes that may be discussed in this communication. This communication has been prepared based upon information, including market prices, data and other information, from sources believed to be reliable, but J.P. Morgan does not warrant its completeness or accuracy. Any opinions and estimates constitute our judgment as of the date of this material and are subject to change without notice. Past performance is not indicative of future results. This communication is not intended as an offer or solicitation for the purchase or sale of any financial instrument. J.P. Morgan Research does not provide individually tailored investment advice. Any opinions and recommendations herein do not take into account individual client circumstances, objectives, or needs and are not intended as recommendations of particular securities, financial instruments or strategies to particular clients. You must make your own independent decisions regarding any securities, financial instruments or strategies mentioned or related to the information herein. Periodic updates may be provided on companies, issuers or industries based on specific developments or announcements, market conditions or any other publicly available information. However, J.P. Morgan may be restricted from updating information contained in this communication for regulatory or other reasons. This communication may not be redistributed or retransmitted, in whole or in part, or in any form or manner, without the express written consent of J.P. Morgan. Any unauthorized use or disclosure is prohibited. Receipt and review of this information constitutes your agreement not to redistribute or retransmit the contents and information contained in this communication without first obtaining express permission from an authorized officer of J.P. Morgan.