Our Top Market Takeaways for September 29, 2023

Market update: Climbing the wall of worry

September looks set to live up to its bad reputation as the worst month of the year.

10-year Treasury yields blew past 4.6% this week for the first time since 2007, and heading into Friday, the S&P 500 is down more than -6% from its mid-summer highs.

There has been no shortage of things to worry about. Together, government shutdown fears, surging bond yields, lingering inflation, consumer pain points and questions around China have formed a “wall of worry.”

But while we think more swings should be expected, that wall may not be as formidable as some fear. Today, we take each risk in turn.

1. The government’s budget battle.

Congress must pass a budget or a short-term spending deal (i.e., a “continuing resolution”) by midnight tomorrow, September 30, to keep the government’s lights on. Over the last several weeks, Congress has been working toward the latter, which would offer stopgap funding while budget talks continue. But even with that band-aid approach, policymakers still seem far apart on a deal, making the risk of a government shutdown a very real one.

In a shutdown, all “nonessential” departments – such as the Environmental Protection Agency (EPA), the Labor Department and parts of the Internal Revenue Service (IRS) – will be forced to power down. Many federal workers could see paychecks for their services delayed or suspended, and the reporting of key government data (like on inflation and unemployment) could also be impacted.

That said, we’ve seen a handful of government shutdowns before, with the longest in 2018 (which lasted over a month). The impact tends to grow the longer shutdowns last, but as the government eventually reopens, the hit to growth and stocks is typically short-lived. For instance, looking at the full history of government shutdowns (from the time they started to ended), U.S. stocks have actually been about flat on average.

This bar graph describes S&P 500 returns during prior U.S. government shutdowns, percentage

In all, staying invested through the uncertainty has typically served investors best.

2. Higher for longer rates.

Last week, the Federal Reserve hit “pause” after 525 basis points worth of rate hikes, but policymakers also signaled they intend to keep policy rates “higher for longer” to finish their inflation fight. This has prompted a surge in yields that has been painful for bond investors. It’s also led investors to question whether they are paying a fair price for stocks.

There may be further spikes in yields from here, but we don’t expect this surge to go on indefinitely. With borrowing rates as high as they are, the decision to stay in cash and save versus spend or invest is becoming more difficult. This dials up the pressure on growth, and at some point, should prompt bond yields to stabilize, if not fall. What’s more, today’s high levels now offer a more defensive entry point—and compelling income. Just over three years ago, 10-year Treasury yields were at an all-time low of 0.5%.

When it comes to stocks, the recent selloff means valuations are more reasonable today than they were before. At 18.1x, the S&P 500 is trading just above its long-term average, and stripping out the Magnificent 7 mega-cap companies that have led the rally, it looks even better. Focusing on valuations alone also ignores the actual experience of companies. The S&P 500 has already suffered through three quarters of earnings declines, and expectations for future earnings have been rising steadily over the last six months.

Despite all the worry, that backdrop could spur stocks to new highs over the next year.

3. Lingering inflation.

The summer climb in energy prices has caused some angst. WTI crude popped as high as $95 per barrel this week, and that has also pushed the average price of regular U.S. gasoline to $3.85 per gallon, up from around $3.50 just a few months ago. What’s more, the rise in strikes for better pay has underlined the knock-on effects of tight labor markets, prompting concerns that collective action could add pressure to wages and, in turn, prices.

In all, we don’t think these dynamics undo all the Federal Reserve’s progress on inflation, and we see more cooling over the next year (even if it’s bumpy). More signs than not point to easing oil prices ahead. Still-declining rent prices for new leases signal softer shelter inflation. And when it comes to work stoppages, negotiations between Teamsters/UPS and SAG-AFTRA/Hollywood Studios show that compromise is possible and the broader economic impact minimal.

This bar graph shows the U.S. Core Consumer Price Index (CPI)’s YoY percentage change, with the levels of the components also included.

Nonetheless, inflation could settle at a higher place this cycle than it did in the last. To us, this means that alternatives such as real assets can offer protection – as well as access to long-term trends around industrial policy and the energy transition.

4. Consumer pain points.

To be sure, there are pain points: Excess savings are all but gone, higher energy prices aren’t fun, 30-year fixed mortgage rates are well above 7%, credit card delinquencies are ticking up (from a very low base) and the end of the student debt moratorium stands to squeeze millennials’ pocketbooks.

This line graph describes the U.S. 30-year fixed mortgage rate, national average, percentage.

A slowdown after the COVID-era boom should be expected, but none of these challenges look like enough to break the broad consumer’s back. For one, most who want a job have one. The labor market is strong, and there are still 1.4 job openings available for every unemployed person. Consumers only spend about 4% of their wallet share on energy goods and services (versus almost 10% in the 1970s). Many student loan borrowers say they plan to delay interest payments over the one-year grace period. And broadly, household finances look well-equipped to handle the challenge: U.S. consumer balance sheets are at an all-time high, and household debt service overall still looks manageable.

This line graph describes the U.S. household debt payments as a % of disposable income.

5. China: From growth concerns to geopolitics.

China’s reopening process has been disappointing, and policymakers’ piecemeal approach to stimulus has made it hard to stabilize the property market and broader economy.

Looking forward, geopolitics is always a risk, but some green shoots suggest that all of policymakers’ smaller moves are starting to have an impact in aggregate. While we wait to find out, we’re also reminded that China’s economic and market impact on the rest of the world is not as big as many often think. For instance, only 1.5% of U.S. corporate income is from sales in China. This means that China’s challenges probably shouldn’t derail our broader view on markets.

Investment considerations: Investing through uncertainty

There may be more pain and volatility along the way, but we still see the potential for higher markets over the next year.

While pullbacks are painful, we’re reminded that selloffs like these aren’t all that unusual. Going back to 1980, the average year has seen a drawdown of around -14%. This year’s selloff is just about half that. What’s more, staying invested tends to be a rewarding mantra for investors. Despite those drawdowns, stocks have gone on to finish the year higher 75% of the time.

This bar graph shows how stocks tend to reward long-term investors by showing S&P 500 intra-year declines (max drawdowns) & calendar year returns.

In the end, we think markets can climb the wall of worry, even if it takes some time. And with stocks and bonds now accounting for a fair degree of pain, that seems to offer an even more attractive entry point for multi-asset class investors.

Your J.P. Morgan team is here to discuss opportunities we see in the context of your portfolio.

All market data from FactSet and Bloomberg Finance L.P., 9/29/23.

Connect with a Wealth Advisor

Our Wealth Advisors begin by getting to know you personally. To get started, tell us about your needs and we’ll reach out to you.

Connect now

DISCLOSURES

Small capitalization companies typically carry more risk than well-established "blue-chip" companies since smaller companies can carry a higher degree of market volatility than most large cap and/or blue-chip companies.

International investments may not be suitable for all investors. International investing involves a greater degree of risk and increased volatility. Changes in currency exchange rates and differences in accounting and taxation policies outside the U.S. can raise or lower returns. Some overseas markets may not be as politically and economically stable as the United States and other nations. Investments in international markets can be more volatile.

Given the complex risk-reward trade-offs involved, we advise clients to rely on judgment as well as quantitative optimization approaches in setting strategic allocations. Please note that all information shown is based on qualitative analysis. Exclusive reliance on the above is not advised. This information is not intended as a recommendation to invest in any particular asset class or strategy or as a promise of future performance. Note that these asset class and strategy assumptions are passive only – they do not consider the impact of active management. References to future returns are not promises or even estimates of actual returns a client portfolio may achieve. Assumptions, opinions and estimates are provided for illustrative purposes only. They should not be relied upon as recommendations to buy or sell securities. Forecasts of financial market trends that are based on current market conditions constitute our judgment and are subject to change without notice. We believe the information provided here is reliable, but do not warrant its accuracy or completeness. This material has been prepared for information purposes only and is not intended to provide, and should not be relied on for, accounting, legal or tax advice. The outputs of the assumptions are provided for illustration/discussion purposes only and are subject to significant limitations.

“Expected” or “alpha” return estimates are subject to uncertainty and error. For example, changes in the historical data from which it is estimated will result in different implications for asset class returns. Expected returns for each asset class are conditional on an economic scenario; actual returns in the event the scenario comes to pass could be higher or lower, as they have been in the past, so an investor should not expect to achieve returns similar to the outputs shown herein. References to future returns for either asset allocation strategies or asset classes are not promises of actual returns a client portfolio may achieve. Because of the inherent limitations of all models, potential investors should not rely exclusively on the model when making a decision. The model cannot account for the impact that economic, market, and other factors may have on the implementation and ongoing management of an actual investment portfolio. Unlike actual portfolio outcomes, the model outcomes do not reflect actual trading, liquidity constraints, fees, expenses, taxes and other factors that could impact the future returns. The model assumptions are passive only – they do not consider the impact of active management. A manager’s ability to achieve similar outcomes is subject to risk factors over which the manager may have no or limited control.

The views contained herein are not to be taken as advice or a recommendation to buy or sell any investment in any jurisdiction, nor is it a commitment from J.P. Morgan Asset Management or any of its subsidiaries to participate in any of the transactions mentioned herein. Any forecasts, figures, opinions or investment techniques and strategies set out are for information purposes only, based on certain assumptions and current market conditions and are subject to change without prior notice. All information presented herein is considered to be accurate at the time of production. This material does not contain sufficient information to support an investment decision and it should not be relied upon by you in evaluating the merits of investing in any securities or products. In addition, users should make an independent assessment of the legal, regulatory, tax, credit and accounting implications and determine, together with their own financial professional, if any investment mentioned herein is believed to be appropriate to their personal goals. Investors should ensure that they obtain all available relevant information before making any investment. It should be noted that investment involves risks, the value of investments and the income from them may fluctuate in accordance with market conditions and taxation agreements and investors may not get back the full amount invested. Both past performance and yield are not a reliable indicator of current and future results.

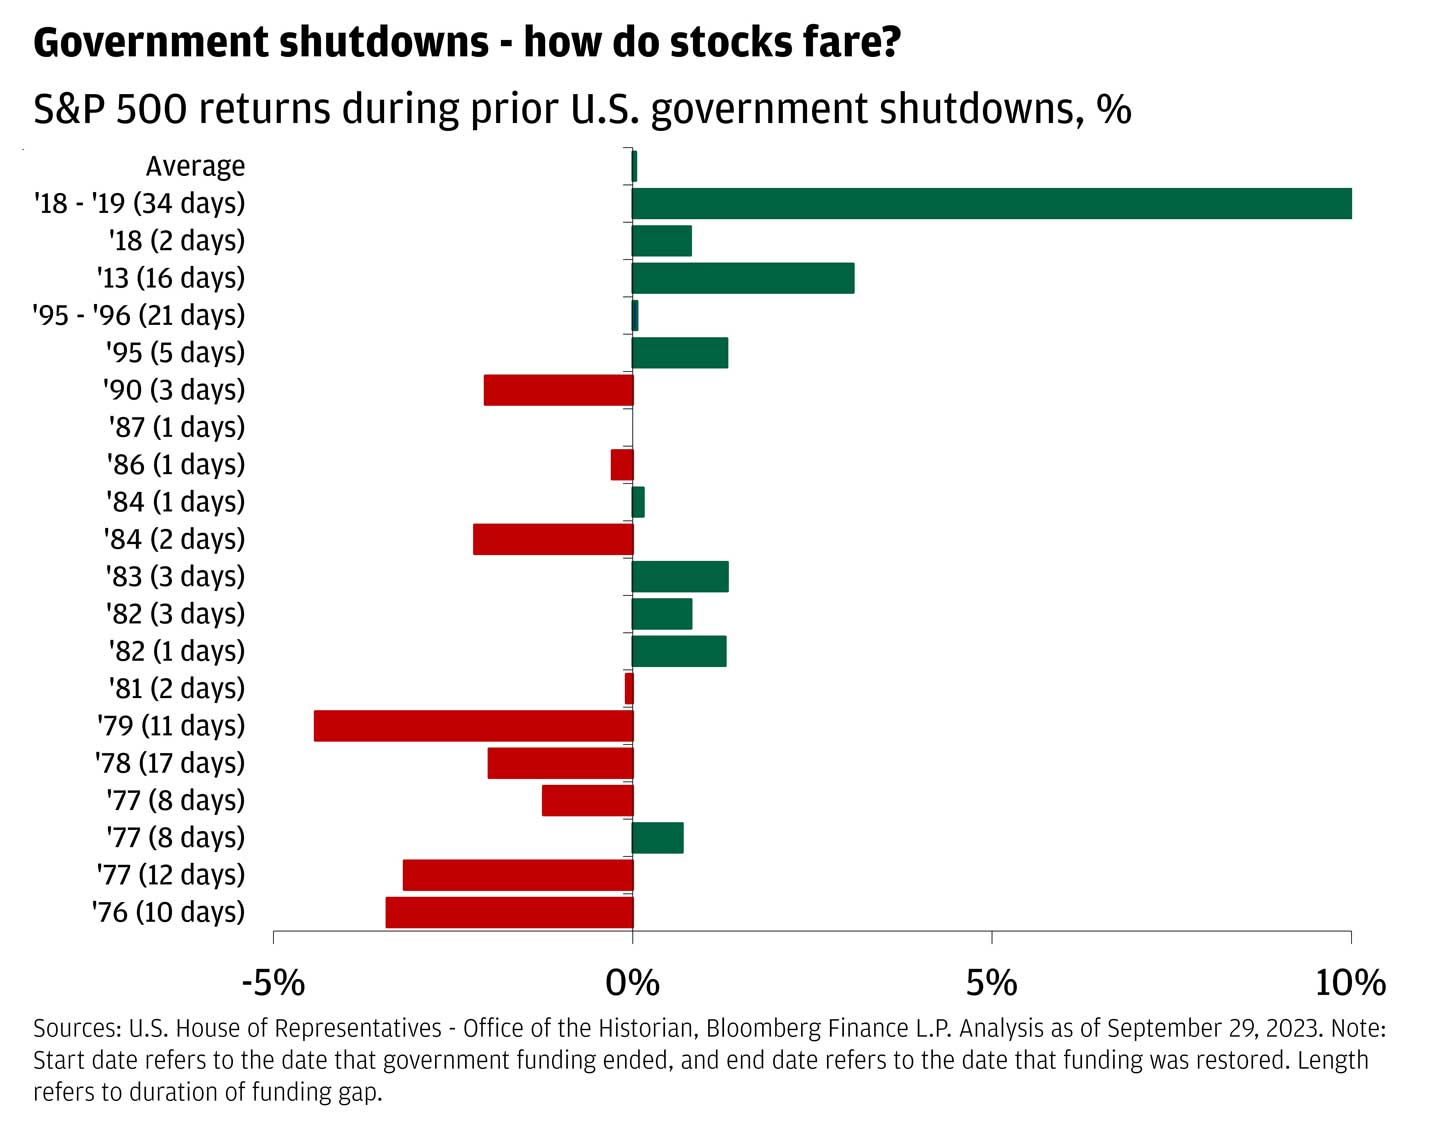
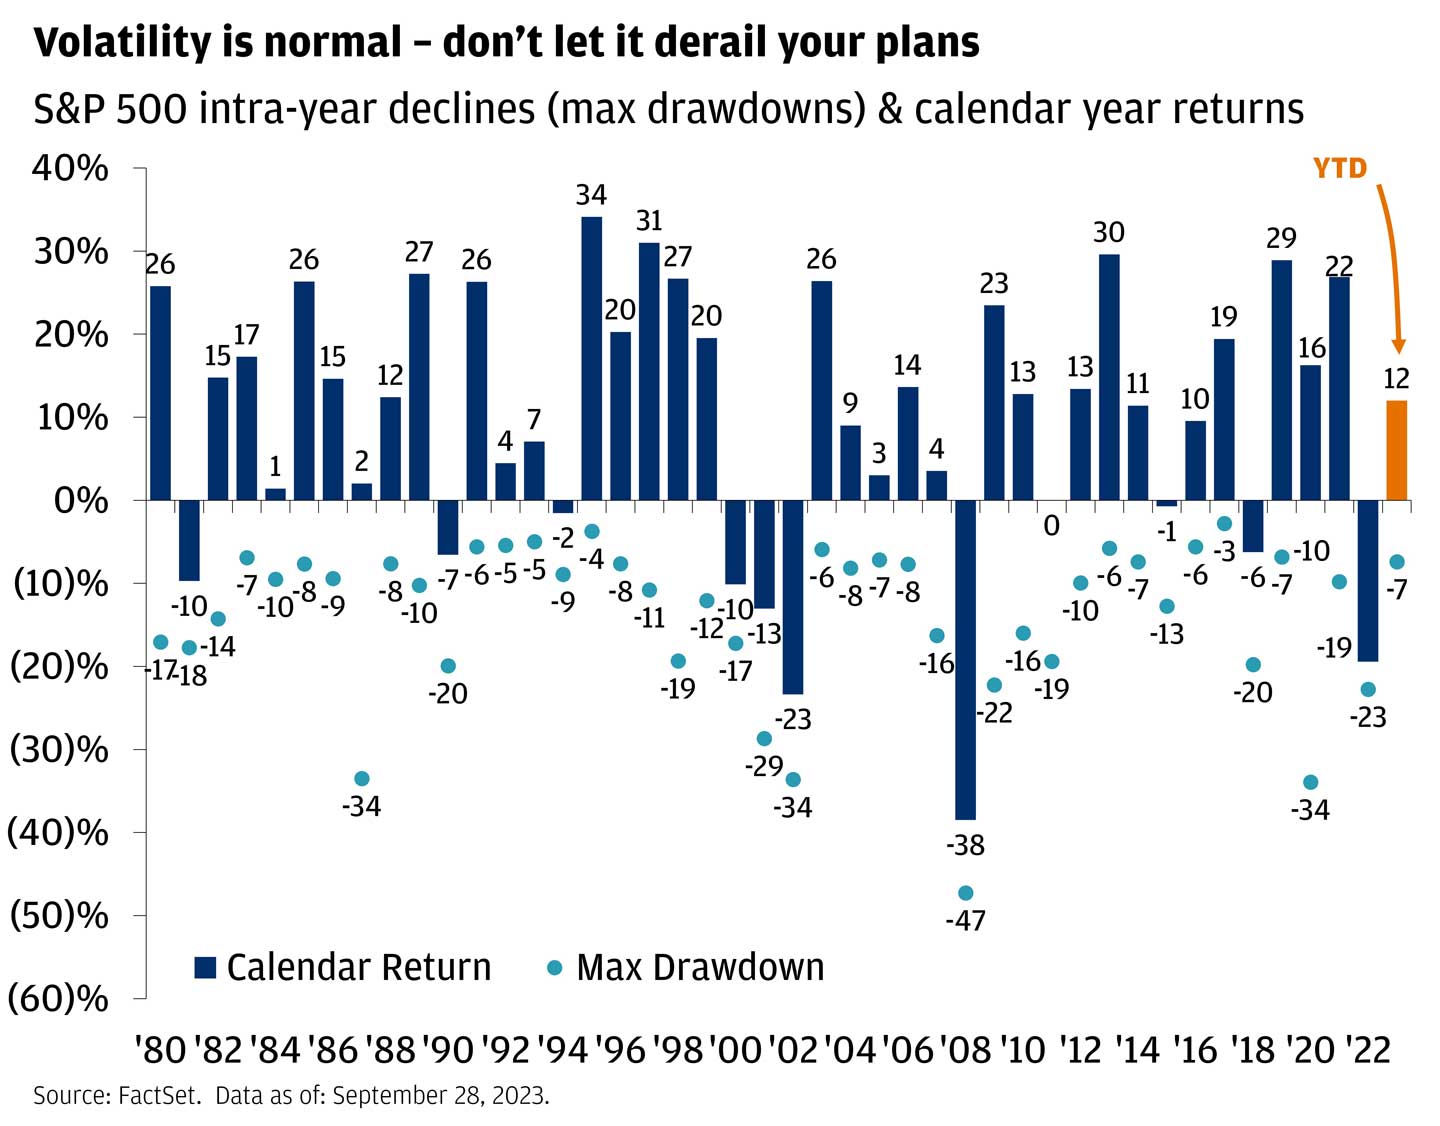
The Standard and Poor's 500, or simply the S&P 500, is a stock market index tracking the stock performance of 500 of the largest companies listed on stock exchanges in the United States. It is one of the most commonly followed equity indices.

The Standard and Poor’s 500 Index is a capitalization-weighted index of 500 stocks. The index is designed to measure performance of the broad domestic economy through changes in the aggregate market value of 500 stocks representing all major industries.

The Bloomberg Eco Surprise Index shows the degree to which economic analysts under- or over-estimate the trends in the business cycle. The surprise element is defined as the percentage difference between analyst forecasts and the published value of economic data releases.

The NASDAQ 100 Index is a basket of the 100 largest, most actively traded U.S companies listed on the NASDAQ stock exchange. The index includes companies from various industries except for the financial industry, like commercial and investment banks. These non-financial sectors include retail, biotechnology, industrial, technology, health care, and others.

The MSCI World Index is a broad global developed markets equity benchmark designed to support: Asset allocation: Consistent, broad representation of the performance of developed equity markets worldwide, without home bias.

The Bloomberg Aggregate Bond Index or "the Agg" is a broad-based fixed-income index used by bond traders and the managers of mutual funds and exchange-traded funds (ETFs) as a benchmark to measure their relative performance.

The NYSE FANG+ Index is an equal-dollar weighted index designed to represent a segment of the technology and consumer discretionary sectors consisting of highly-traded growth stocks of technology and tech-enabled companies such as Facebook, Apple, Amazon, Netflix, and Alphabet's Google.

We believe the information contained in this material to be reliable but do not warrant its accuracy or completeness. Opinions, estimates, and investment strategies and views expressed in this document constitute our judgment based on current market conditions and are subject to change without notice.

RISK CONSIDERATIONS

  • Past performance is not indicative of future results. You may not invest directly in an index.
  • Investing in fixed income products is subject to certain risks, including interest rate, credit, inflation, call, prepayment and reinvestment risk. Any fixed income security sold or redeemed prior to maturity may be subject to substantial gain or loss.
  • The price of equity securities may rise or fall due to the changes in the broad market or changes in a company's financial condition, sometimes rapidly or unpredictably. Equity securities are subject to 'stock market risk' meaning that stock prices in general may decline over short or extended periods of time.
  • The prices and rates of return are indicative, as they may vary over time based on market conditions.
  • As a reminder, hedge funds (or funds of hedge funds) often engage in leveraging and other speculative investment practices that may increase the risk of investment loss. These investments can be highly illiquid, and are not required to provide periodic pricing or valuation information to investors, and may involve complex tax structures and delays in distributing important tax information. These investments are not subject to the same regulatory requirements as mutual funds; and often charge high fees. Further, any number of conflicts of interest may exist in the context of the management and/or operation of any such fund. For complete information, please refer to the applicable offering memorandum.
  • Structured products involve derivatives and risks that may not be suitable for all investors. The most common risks include, but are not limited to, risk of adverse or unanticipated market developments, issuer credit quality risk, risk of lack of uniform standard pricing, risk of adverse events involving any underlying reference obligations, risk of high volatility, risk of illiquidity/little to no secondary market, and conflicts of interest. Before investing in a structured product, investors should review the accompanying offering document, prospectus or prospectus supplement to understand the actual terms and key risks associated with the each individual structured product. Any payments on a structured product are subject to the credit risk of the issuer and/or guarantor. Investors may lose their entire investment, i.e., incur an unlimited loss. The risks listed above are not complete. For a more comprehensive list of the risks involved with this particular product, please speak to your J.P. Morgan team.
  • Additional risk considerations exist for all strategies.
  • The information provided herein is not intended as a recommendation of or an offer or solicitation to purchase or sell any investment product or service.
  • Structured products are complex debt obligations of a corporate issuer the return of which is linked to the performance of an underlying asset. They are significantly riskier than conventional debt instruments and may not be suitable for all investors.
  • Investment in alternative investment strategies is speculative, often involves a greater degree of risk than traditional investments including limited liquidity and limited transparency, among other factors and should only be considered by sophisticated investors with the financial capability to accept the loss of all or part of the assets devoted to such strategies.
  • Opinions expressed herein may differ from the opinions expressed by other areas of J.P. Morgan. This material should not be regarded as investment research or a J.P. Morgan investment research report.

IMPORTANT INFORMATION

All companies referenced are shown for illustrative purposes only, and are not intended as a recommendation or endorsement by J.P. Morgan in this context.

Bonds are subject to interest rate risk, credit and default risk of the issuer. Bond prices generally fall when interest rates rise. Investing in fixed income products is subject to certain risks, including interest rate, credit, inflation, call, prepayment and reinvestment risk. Any fixed income security sold or redeemed prior to maturity may be subject to substantial gain or loss.

This material is for information purposes only, and may inform you of certain products and services offered by J.P. Morgan’s wealth management businesses, part of JPMorgan Chase & Co. (“JPM”). The views and strategies described in the material may not be suitable for all investors and are subject to investment risks. Please read all Important Information.

  • The Standard and Poor’s 500 Index is a capitalization-weighted index of 500 stocks. The index is designed to measure performance of the broad domestic economy through changes in the aggregate market value of 500 stocks representing all major industries.

GENERAL RISKS & CONSIDERATIONS. Any views, strategies or products discussed in this material may not be appropriate for all individuals and are subject to risks. Investors may get back less than they invested, and past performance is not a reliable indicator of future results. Asset allocation/diversification does not guarantee a profit or protect against loss. Nothing in this material should be relied upon in isolation for the purpose of making an investment decision. You are urged to consider carefully whether the services, products, asset classes (e.g. equities, fixed income, alternative investments, commodities, etc.) or strategies discussed are suitable to your needs. You must also consider the objectives, risks, charges, and expenses associated with an investment service, product or strategy prior to making an investment decision. For this and more complete information, including discussion of your goals/situation, contact your J.P. Morgan team.

NON-RELIANCE. Certain information contained in this material is believed to be reliable; however, JPM does not represent or warrant its accuracy, reliability or completeness, or accept any liability for any loss or damage (whether direct or indirect) arising out of the use of all or any part of this material. No representation or warranty should be made with regard to any computations, graphs, tables, diagrams or commentary in this material, which are provided for illustration/reference purposes only. The views, opinions, estimates and strategies expressed in this material constitute our judgment based on current market conditions and are subject to change without notice. JPM assumes no duty to update any information in this material in the event that such information changes. Views, opinions, estimates and strategies expressed herein may differ from those expressed by other areas of JPM, views expressed for other purposes or in other contexts, and this material should not be regarded as a research report. Any projected results and risks are based solely on hypothetical examples cited, and actual results and risks will vary depending on specific circumstances. Forward-looking statements should not be considered as guarantees or predictions of future events.

Nothing in this document shall be construed as giving rise to any duty of care owed to, or advisory relationship with, you or any third party. Nothing in this document shall be regarded as an offer, solicitation, recommendation or advice (whether financial, accounting, legal, tax or other) given by J.P. Morgan and/or its officers or employees, irrespective of whether or not such communication was given at your request. J.P. Morgan and its affiliates and employees do not provide tax, legal or accounting advice. You should consult your own tax, legal and accounting advisors before engaging in any financial transactions.

LEGAL ENTITY, BRAND & REGULATORY INFORMATION

In the United States, bank deposit accounts and related services, such as checking, savings and bank lending, are offered by JPMorgan Chase Bank, N.A. Member FDIC.

J.P. Morgan Wealth Management is a business of JPMorgan Chase & Co., which offers investment products and services through J.P. Morgan Securities LLC (JPMS), a registered broker-dealer and investment adviser, member FINRA and SIPC. Insurance products are made available through Chase Insurance Agency, Inc. (CIA), a licensed insurance agency, doing business as Chase Insurance Agency Services, Inc. in Florida. Certain custody and other services are provided by JPMorgan Chase Bank, N.A. (JPMCB). JPMS, CIA and JPMCB are affiliated companies under the common control of JPMorgan Chase & Co. Products not available in all states.