
Contributors
U.S. Head of Investment Strategy
Amanda Lott
Head of Wealth Planning Strategy, Advice Lab
Market Update
There is no question that the market environment has changed.
Obviously, stock prices are lower. The S&P 500 is currently 6% below its all-time high reached in the middle of July, U.S. small caps have given back all their year-to-date gains and Japanese stocks endured a full bear market over the course of two weeks.
Bond yields are also lower. 10-year U.S. Treasury yields are down by 15 basis points. Two-year yields, which are more sensitive to changes in the outlook for Federal Reserve policy, have collapsed by nearly 40 basis points.
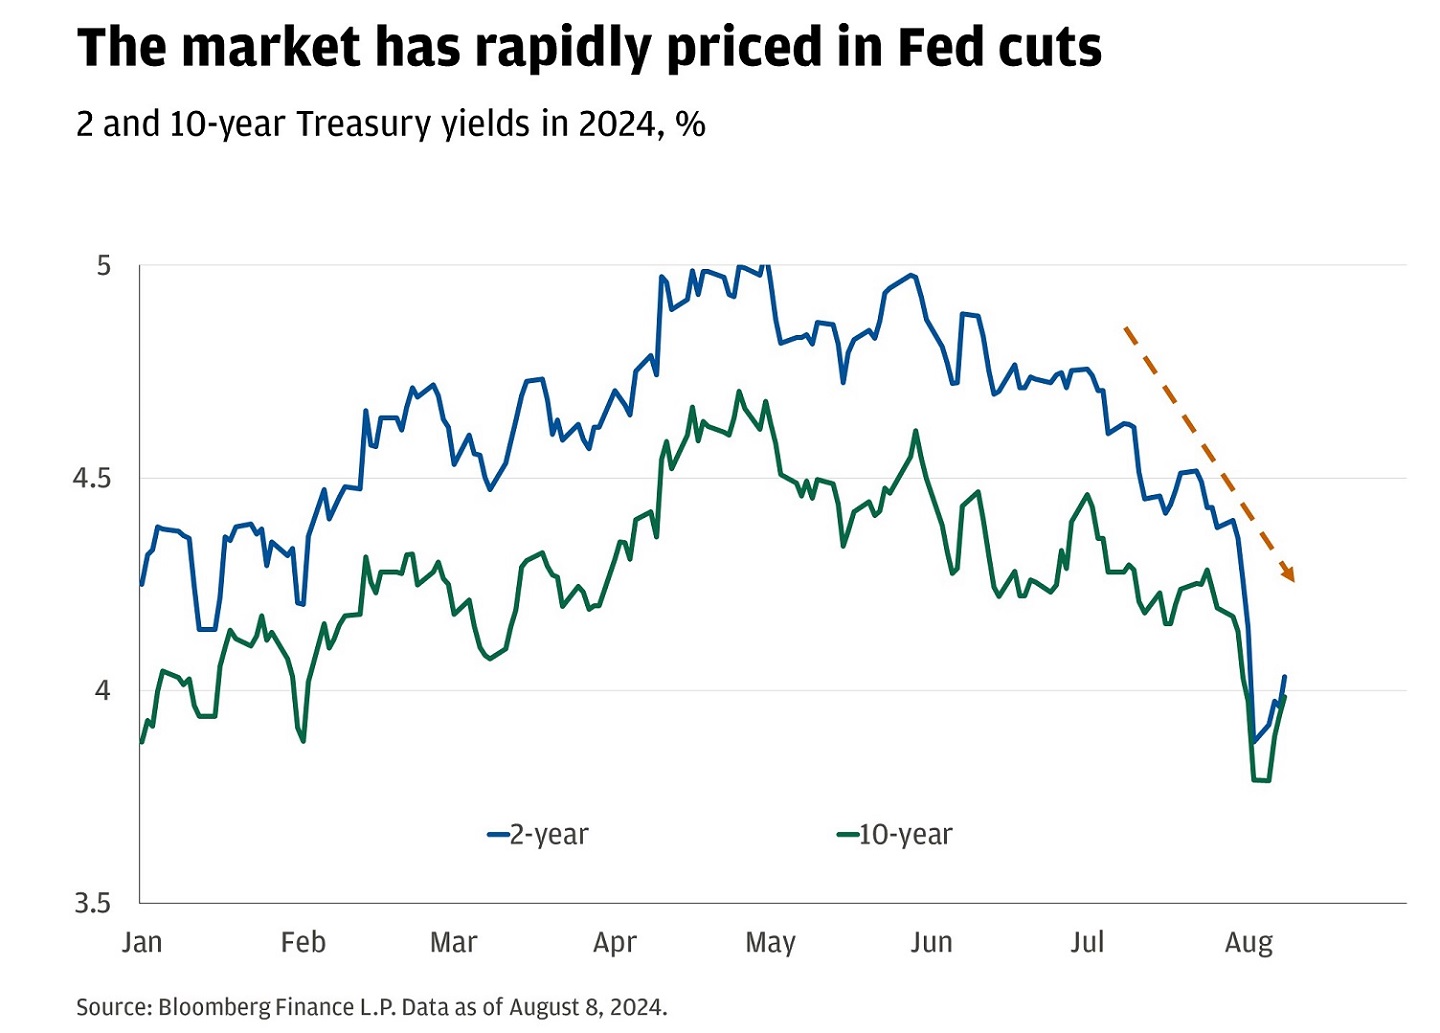
The market has rapidly priced in Fed cuts
2 and 10-year Treasury yields in 2024, percentage
This chart shows the yields for 2-yr and 10-yr Treasury bonds over the course of 2024 so far.
- In January, the 2-year was at 4.25% and the 10-year was at 3.88%.
- In February, the 2-year was at 4.20% and the 10-year was at 3.88%.
- In March, the 2-year was at 4.53% and the 10-year was at 3.18%.
- In April, the 2-year was at 4.70% and the 10-year was at 4.31%.
- In May, the 2-year was at 4.96% and the 10-year was at 4.62%.
- In June, the 2-year was at 4.81% and the 10-year was at 4.38%.
- In July, the 2-year was at 4.76% and the 10-year was at 4.46%.
- In August, the 2-year was at 4.14% and the 10-year was at 3.96%.
Source: Bloomberg Finance L.P. Data as of August 8, 2024.
Implied volatility is also higher. The S&P 500 needs to move 1.5% in either direction daily for the next month to justify the currently level of the CBOE Volatility Index (VIX), versus just an 0.8% daily move two weeks ago.
We believe these changes are driven by three main factors which drove investors to flee crowded positions:
- Growth scare: There is a higher risk of recession now than there was just two weeks ago. The jobs data released at the beginning of August were weak and triggered the “Sahm Rule” which has coincided with every recession since 1970. We don’t believe the economy is currently in recession and that the most likely outcome is continued expansion. Layoffs are low, corporate profits are rising, margins are healthy and output is solid. That said, the Federal Reserve likely doesn’t have the flexibility to wait and see. We think they are on the precipice of a material easing cycle. The message for investors is clear: Cash is likely set to underperform bonds like it has in 11 of the 12 easing cycles over the last 50 years.
- Artificial intelligence skepticism: There is more skepticism around the earnings benefits from Artificial intelligence. Earnings season from the perceived “AI winners” was solid, yet unspectacular. That is part of the problem. Investors had grown more optimistic that AI would start to show a more pronounced return on investment. If there was an “AI premium” embedded in the market, it is largely gone. The tech heavy Nasdaq 100 is now underperforming the broad market year to date. The forward price-to-earnings ratios for three of the four “hyperscalers” are lower now than what they were at the start of the year. We believe that AI has the potential to drive meaningful economic, productivity and earnings benefits over the next decade. The valuations of stocks that could be best positioned to benefit trade at a premium to the market, but don’t look too stretched relative to their own history.
- The U.S. Election: Long-term investors are probably best served to focus more on strategic asset allocation and implementation decisions rather than shifting perceptions of election outcomes, but they do seem to drive markets in the short-term. Since the middle of July, implied election odds have moved back to effectively a toss-up from a greater than 70% chance that President Trump would be re-elected. The stock market is not reacting to one candidate or another as much as it is reacting to a more uncertain outlook for the outcome in November. That necessitates lower valuations.
We still have a constructive view on markets despite a more pronounced risk of a more material growth slowdown. As we move through the end of the summer and into the fall, we will likely view increased volatility as an opportunity to put money to work across asset classes.
Spotlight: Seven considerations to make the most of market volatility
Market volatility may be normal, but it should still spark action. In the rest of today’s Top Market Takeaways, we list seven approaches we think investors can consider to make the most of the sell-off.
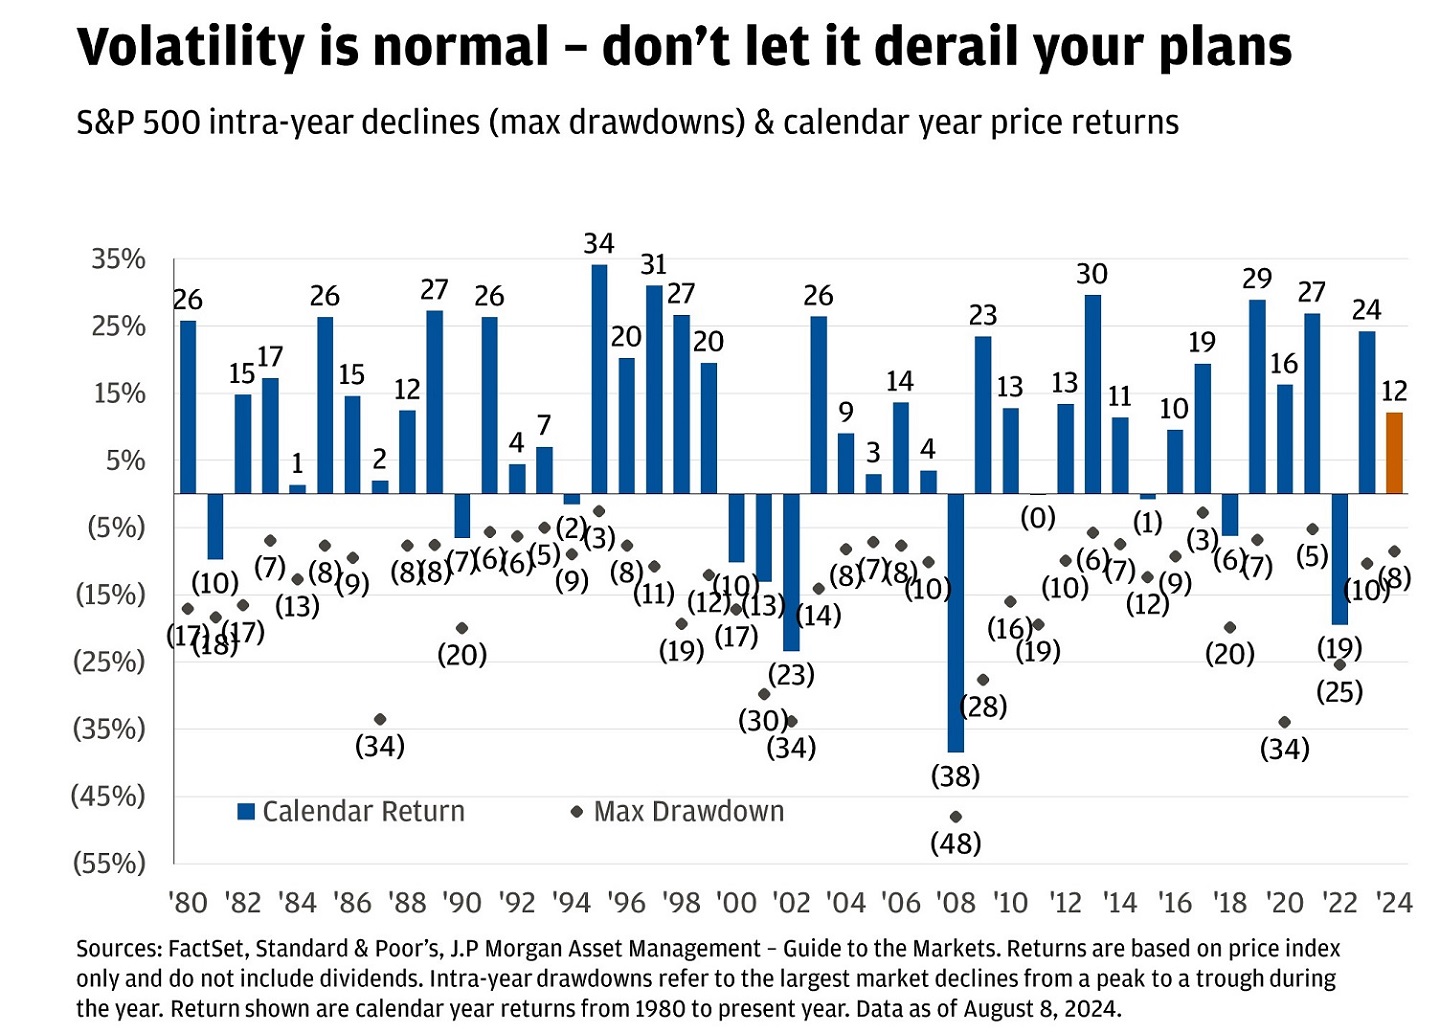
Volatility is normal – don’t let it derail your plans
S&P 500 intra-year declines (max drawdowns) & calendar year price returns
This chart shows the S&P 500 calendar year price returns and maximum intra-year drawdowns from 1980 to February 2024.
- In 1980, the calendar year price return was 25.77% and the maximum intra-year drawdown was -17.07%.
- In 1981, the calendar year price return was -9.73% and the maximum intra-year drawdown was -18.35%.
- In 1982, the calendar year price return was 14.76% and the maximum intra-year drawdown was -16.56%.
- In 1983, the calendar year price return was 17.27% and the maximum intra-year drawdown was -6.91%.
- In 1984, the calendar year price return was 1.4% and the maximum intra-year drawdown was -12.68%.
- In 1985, the calendar year price return was 26.33% and the maximum intra-year drawdown was -7.66%.
- In 1986, the calendar year price return was 14.62% and the maximum intra-year drawdown was -9.42%.
- In 1987, the calendar year price return was 2.03% and the maximum intra-year drawdown was -33.51%.
- In 1988, the calendar year price return was 12.4% and the maximum intra-year drawdown was -7.63%.
- In 1989, the calendar year price return was 27.25% and the maximum intra-year drawdown was -7.56%.
- In 1990, the calendar year price return was -6.56% and the maximum intra-year drawdown was -19.92%.
- In 1991, the calendar year price return was 26.31% and the maximum intra-year drawdown was -5.6%.
- In 1992, the calendar year price return was 4.46% and the maximum intra-year drawdown was -6.24%.
- In 1993, the calendar year price return was 7.06% and the maximum intra-year drawdown was -4.99%.
- In 1994, the calendar year price return was -1.54% and the maximum intra-year drawdown was -8.94%.
- In 1995, the calendar year price return was 34.11% and the maximum intra-year drawdown was -2.53%.
- In 1996, the calendar year price return was 20.26% and the maximum intra-year drawdown was -7.64%.
- In 1997, the calendar year price return was 31.01% and the maximum intra-year drawdown was -10.8%.
- In 1998, the calendar year price return was 26.67% and the maximum intra-year drawdown was -19.34%.
- In 1999, the calendar year price return was 19.53% and the maximum intra-year drawdown was -12.08%.
- In 2000, the calendar year price return was -10.14% and the maximum intra-year drawdown was -17.2%.
- In 2001, the calendar year price return was -13.04% and the maximum intra-year drawdown was -29.7%.
- In 2002, the calendar year price return was -23.37% and the maximum intra-year drawdown was -33.75%.
- In 2003, the calendar year price return was 26.38% and the maximum intra-year drawdown was -14.05%.
- In 2004, the calendar year price return was 8.99% and the maximum intra-year drawdown was -8.16%.
- In 2005, the calendar year price return was 3% and the maximum intra-year drawdown was -7.17%.
- In 2006, the calendar year price return was 13.62% and the maximum intra-year drawdown was -7.7%.
- In 2007, the calendar year price return was 3.53% and the maximum intra-year drawdown was -10.09%.
- In 2008, the calendar year price return was -38.49% and the maximum intra-year drawdown was -48.01%.
- In 2009, the calendar year price return was 23.45% and the maximum intra-year drawdown was -27.62%.
- In 2010, the calendar year price return was 12.78% and the maximum intra-year drawdown was -15.99%.
- In 2011, the calendar year price return was 0% and the maximum intra-year drawdown was -19.39%.
- In 2012, the calendar year price return was 13.41% and the maximum intra-year drawdown was -9.94%.
- In 2013, the calendar year price return was 29.6% and the maximum intra-year drawdown was -5.76%.
- In 2014, the calendar year price return was 11.39% and the maximum intra-year drawdown was -7.4%.
- In 2015, the calendar year price return was -0.73% and the maximum intra-year drawdown was -12.35%.
- In 2016, the calendar year price return was 9.54% and the maximum intra-year drawdown was -9.3%.
- In 2017, the calendar year price return was 19.42% and the maximum intra-year drawdown was -2.8%.
- In 2018, the calendar year price return was -6.24% and the maximum intra-year drawdown was -19.78%.
- In 2019, the calendar year price return was 28.88% and the maximum intra-year drawdown was -6.84%.
- In 2020, the calendar year price return was 16.26% and the maximum intra-year drawdown was -33.93%.
- In 2021, the calendar year price return was 26.89% and the maximum intra-year drawdown was -5.21%.
- In 2022, the calendar year price return was -19.44% and the maximum intra-year drawdown was -25.43%.
- In 2023, the calendar year price return was 24.23% and the maximum intra-year drawdown was -10.28%.
- The last data point is as of July 2024, where the year-to-date price return was 12% and the maximum year to date drawdown was -8%.
Source: FactSet, Standard & Poor’s, J.P Morgan Asset Management – Guide to the Markets. Returns are based on price index only and do not include dividends. Intra-year drawdowns refer to the largest market declines from a peak to a trough during the year. Return shown are calendar year returns from 1980 to present year. Data as of July 31, 2024.
Revisit your plan. Use this period of market volatility as an opportunity to revisit a comprehensive wealth plan. This ensures that financial goals are clearly defined and aligned with your long-term objectives. When portfolios are properly aligned with intent, it is likely that they are also designed to withstand this type of volatility. Don’t have a plan? Use the sell-off to put a holistic plan in place. It could help relieve the trepidation associated with the next one.
Rebalance your portfolio. Review and rebalance portfolios to maintain your strategic asset allocation. Equities have pulled back and fixed income has rallied, which may result in unwanted drift. We added to equities in portfolios that we manage on behalf of clients earlier this week to maintain proper levels of exposure.
Put idle cash to work. Using stock market pullbacks to increase equity exposure can be a prudent strategy. Average returns for the S&P 500 twelve months after a 5% pullback are nearly 12% and markets are higher nearly 75% of the time. Don’t know where to start? Consider funding trusts, Roth IRAs, UTMAs or 529 plans during market downturns. These types of accounts typically have longer time horizons that should reduce some anxiety about trying to time the market. Still nervous? Consider structured investments, which offer the potential to participate in some market appreciation with embedded downside protection.
Lock in yields. Treasury rates are falling fast now that it seems likely that the Federal Reserve is going to cut rates. Tax-equivalent yields in municipal bonds for most taxpayers are still above 5%, but may not be there for long. History suggests that if you invest one month before the Fed starts cutting, average 12 month returns in municipal bonds are over 300 basis points higher than if you waited until one month after the first cut.
Tax-loss harvest. Investors don't have to wait until December. Consider offsetting gains and reducing your tax burden. This can be particularly effective during periods of market downturns. Investors can also explore using managers who actively manage tax losses on an ongoing basis.
Transfer assets and consider paying taxes now. Moving assets off your personal balance sheet can be more tax efficient when they have depreciated. The idea is that future appreciation of these assets will occur outside your estate, potentially reducing estate taxes. Make the most of annual exclusion and lifetime gifts. Consider funding Grantor Retained Annuity Trusts (GRATs) with depreciated assets or swapping assets into a Grantor trust, if you anticipate a market recovery. If you are considering converting a traditional IRA to a Roth IRA, a market dip may be the opportune time. Similarly, public and private corporate executives ought to consider exercising their options as it could be more tax efficient to do so when stock prices are low. Investors should consult their tax, legal and accounting advisors when considering making financial transactions.
Keep things in perspective. The stock market has returned nearly 12.5% this year and has sold off by 6% from prior all-time highs. The average year that ends with a gain comes with an 11% peak to trough drawdown. The cost of outsized returns from equity markets is this type of volatility. Also, if the bull market that started in October 2022 is over, it would be the shortest on record. Instead, it seems more likely to us that this bull market extends towards the median gain of 110% over four years from its current length of 40% in less than two years.
Volatility can be uncomfortable. Your JPMorgan advisor is here to help you make the most of it.
All market and economic data as of 08/09/2024 are sourced from Bloomberg Finance L.P. and FactSet unless otherwise stated.
The risks listed above are not complete. For a more comprehensive list of the risks involved with this particular product, please speak to your J.P. Morgan team.
Connect with a Wealth Advisor
Our Wealth Advisors begin by getting to know you personally. To get started, tell us about your needs and we’ll reach out to you.
DISCLOSURES
Tax loss harvesting may not be appropriate for everyone. If you do not expect to realize net capital gains this year, have net capital loss carryforwards, are concerned about deviation from your model investment portfolio, and/or are subject to low income tax rates or invest through a tax-deferred account, tax loss harvesting may not be optimal for your account. You should discuss these matters with your investment and tax advisors.
The Chicago Board Option Exchange (CBOE) Volatility Index (VIX), is a real-time index that represents the market’s expectations for the relative strength of near-term price changes of the S&P 500 Index.
The information presented is not intended to be making value judgments on the preferred outcome of any government decision or political election.
Index definitions:
The Russell 3000 Index is a capitalization-weighted stock market index that seeks to be a benchmark of the entire U.S. stock market. It measures the performance of the largest 3,000 U.S. companies representing approximately 96% of the investable U.S. equity market.
The S&P 500 Equal Weight Index is the equal-weight version of the widely-used S&P 500. The index includes the same constituents as the capitalization weighted S&P 500, but each company in the S&P 500 EWI is allocated a fixed weight of the index total at each quarterly rebalance.
The Bloomberg U.S. Aggregate Bond Index is a broad-based flagship benchmark that measures the investment grade, US dollar-denominated, fixed-rate taxable bond market. The index includes Treasuries, government-related and corporate securities, MBS (agency fixed-rate pass-throughs), ABS and CMBS (agency and non-agency).
The S&P 500 Equal Weighted Index is the equal-weight version of the widely-used S&P 500. The index includes the same constituents as the capitalization weighted S&P 500, but each company in the S&P 500 EWI is allocated a fixed weight – or 0.2% of the index total at each quarterly rebalance.
The Magnificent Seven stocks are a group of influential companies in the U.S. stock market: Alphabet, Amazon, Apple, Meta Platforms, Microsoft, NVIDIA, and Tesla.
The Magnificent 7 Index is an equal-dollar weighted equity benchmark consisting of a fixed basket of 7 widely-traded companies (Microsoft, Apple, Nvidia, Alphabet, Amazon, Meta, Tesla) classified in the United States and representing the Communications, Consumer Discretionary and Technology sectors as defined by Bloomberg Industry Classification System (BICS).
The S&P Midcap 400 Index is a capitalization-weighted index which measures the performance of the mid-range sector of the U.S. stock market.
The S&P 500 index is widely regarded as the best single gauge of large-cap U.S. equities and serves as the foundation for a wide range of investment products. The index includes 500 leading companies and captures approximately 80% coverage of available market capitalization.
Bonds are subject to interest rate risk, credit, call, liquidity and default risk of the issuer. Bond prices generally fall when interest rates rise.
The price of equity securities may rise or fall due to the changes in the broad market or changes in a company's financial condition, sometimes rapidly or unpredictably. Equity securities are subject to "stock market risk" meaning that stock prices in general may decline over short or extended periods of time.
Standard and Poor’s 500 Index is a capitalization-weighted index of 500 stocks. The index is designed to measure performance of the broad domestic economy through changes in the aggregate market value of 500 stocks representing all major industries. The index was developed with a base level of 10 for the 1941–43 base period.
The Bloomberg Eco Surprise Index shows the degree to which economic analysts under- or over-estimate the trends in the business cycle. The surprise element is defined as the percentage difference between analyst forecasts and the published value of economic data releases.
The MSCI World Index is a free float-adjusted market capitalization index that is designed to measure global developed market equity performance.
The NASDAQ 100 Index is a basket of the 100 largest, most actively traded U.S companies listed on the NASDAQ stock exchange. The index includes companies from various industries except for the financial industry, like commercial and investment banks. These non-financial sectors include retail, biotechnology, industrial, technology, health care, and others.
The Russell 2000 Index measures small company stock market performance. The index does not include fees or expenses.
We believe the information contained in this material to be reliable but do not warrant its accuracy or completeness. Opinions, estimates, and investment strategies and views expressed in this document constitute our judgment based on current market conditions and are subject to change without notice.
The views, opinions, estimates and strategies expressed herein constitutes the author's judgment based on current market conditions and are subject to change without notice, and may differ from those expressed by other areas of J.P. Morgan. This information in no way constitutes J.P. Morgan Research and should not be treated as such. You should carefully consider your needs and objectives before making any decisions. For additional guidance on how this information should be applied to your situation, you should consult your advisor.
All companies referenced are shown for illustrative purposes only, and are not intended as a recommendation or endorsement by J.P. Morgan in this context.
JPMorgan Chase & Co., its affiliates, and employees do not provide tax, legal or accounting advice. Information presented on these webpages is not intended to provide, and should not be relied on for tax, legal and accounting advice. You should consult your own tax, legal and accounting advisors before engaging in any financial transaction.
RISK CONSIDERATIONS
- Past performance is not indicative of future results. You may not invest directly in an index.
- The price of equity securities may rise or fall due to the changes in the broad market or changes in a company's financial condition, sometimes rapidly or unpredictably. Equity securities are subject to 'stock market risk' meaning that stock prices in general may decline over short or extended periods of time.
- Investing in fixed income products is subject to certain risks, including interest rate, credit, inflation, call, prepayment and reinvestment risk. Any fixed income security sold or redeemed prior to maturity may be subject to substantial gain or loss.
- In general, the bond market is volatile and bond prices rise when interest rates fall and vice versa. Longer term securities are more prone to price fluctuation than shorter term securities. Any fixed income security sold or redeemed prior to maturity may be subject to substantial gain or loss. Dependable income is subject to the credit risk of the issuer of the bond. If an issuer defaults no future income payments will be made.
- When investing in mutual funds or exchange-traded and index funds, please consider the investment objectives, risks, charges, and expenses associated with the funds before investing. You may obtain a fund’s prospectus by contacting your investment professional. The prospectus contains information, which should be carefully read before investing.
- Investors should understand the potential tax liabilities surrounding a municipal bond purchase. Certain municipal bonds are federally taxed if the holder is subject to alternative minimum tax. Capital gains, if any, are federally taxable. The investor should note that the income from tax-free municipal bond funds may be subject to state and local taxation and the alternative minimum tax (amt).
- International investments may not be suitable for all investors. International investing involves a greater degree of risk and increased volatility. Changes in currency exchange rates and differences in accounting and taxation policies outside the u.s. can raise or lower returns. Some overseas markets may not be as politically and economically stable as the united states and other nations. Investments in international markets can be more volatile.
- Investments in emerging markets may not be suitable for all investors. Emerging markets involve a greater degree of risk and increased volatility. Changes in currency exchange rates and differences in accounting and taxation policies outside the u.s. can raise or lower returns. Some overseas markets may not be as politically and economically stable as the united states and other nations. Investments in emerging markets can be more volatile.
- Investments in commodities may have greater volatility than investments in traditional securities, particularly if the instruments involve leverage. The value of commodity-linked derivative instruments may be affected by changes in overall market movements, commodity index volatility, changes in interest rates, or factors affecting a particular industry or commodity, such as drought, floods, weather, livestock disease, embargoes, tariffs and international economic, political and regulatory developments. Use of leveraged commodity-linked derivatives creates an opportunity for increased return but, at the same time, creates the possibility for greater loss.
- Real estate investments trusts may be subject to a high degree of market risk because of concentration in a specific industry, sector or geographical sector. Real estate investments may be subject to risks including, but not limited to, declines in the value of real estate, risks related to general and economic conditions, changes in the value of the underlying property owned by the trust and defaults by borrower.
- Investment in alternative investment strategies is speculative, often involves a greater degree of risk than traditional investments including limited liquidity and limited transparency, among other factors and should only be considered by sophisticated investors with the financial capability to accept the loss of all or part of the assets devoted to such strategies.
- Structured products involve derivatives and risks that may not be suitable for all investors. The most common risks include, but are not limited to, risk of adverse or unanticipated market developments, issuer credit quality risk, risk of lack of uniform standard pricing, risk of adverse events involving any underlying reference obligations, risk of high volatility, risk of illiquidity/little to no secondary market, and conflicts of interest. Before investing in a structured product, investors should review the accompanying offering document, prospectus or prospectus supplement to understand the actual terms and key risks associated with the each individual structured product. Any payments on a structured product are subject to the credit risk of the issuer and/or guarantor. Investors may lose their entire investment, i.e., incur an unlimited loss. The risks listed above are not complete. For a more comprehensive list of the risks involved with this particular product, please speak to your J.P. Morgan team.
- As a reminder, hedge funds (or funds of hedge funds) often engage in leveraging and other speculative investment practices that may increase the risk of investment loss. These investments can be highly illiquid, and are not required to provide periodic pricing or valuation information to investors, and may involve complex tax structures and delays in distributing important tax information. These investments are not subject to the same regulatory requirements as mutual funds; and often charge high fees. Further, any number of conflicts of interest may exist in the context of the management and/or operation of any such fund. For complete information, please refer to the applicable offering memorandum.
- For informational purposes only -- J.P. Morgan Securities LLC does not endorse, advise on, transmit, sell or transact in any type of virtual currency. Please note: J.P. Morgan Securities LLC does not intermediate, mine, transmit, custody, store, sell, exchange, control, administer, or issue any type of virtual currency, which includes any type of digital unit used as a medium of exchange or a form of digitally stored value.
- The prices and rates of return are indicative, as they may vary over time based on market conditions.
- Additional risk considerations exist for all strategies.
- The information provided herein is not intended as a recommendation of or an offer or solicitation to purchase or sell any investment product or service.
- Opinions expressed herein may differ from the opinions expressed by other areas of J.P. Morgan. This material should not be regarded as investment research or a J.P. Morgan investment research report.
This material is for information purposes only, and may inform you of certain products and services offered by J.P. Morgan’s wealth management businesses, part of JPMorgan Chase & Co. (“JPM”). The views and strategies described in the material may not be suitable for all investors and are subject to investment risks. Please read all Important Information.
GENERAL RISKS & CONSIDERATIONS. Any views, strategies or products discussed in this material may not be appropriate for all individuals and are subject to risks. Investors may get back less than they invested, and past performance is not a reliable indicator of future results. Asset allocation/diversification does not guarantee a profit or protect against loss. Nothing in this material should be relied upon in isolation for the purpose of making an investment decision. You are urged to consider carefully whether the services, products, asset classes (e.g. equities, fixed income, alternative investments, commodities, etc.) or strategies discussed are suitable to your needs. You must also consider the objectives, risks, charges, and expenses associated with an investment service, product or strategy prior to making an investment decision. For this and more complete information, including discussion of your goals/situation, contact your J.P. Morgan team.
NON-RELIANCE. Certain information contained in this material is believed to be reliable; however, JPM does not represent or warrant its accuracy, reliability or completeness, or accept any liability for any loss or damage (whether direct or indirect) arising out of the use of all or any part of this material. No representation or warranty should be made with regard to any computations, graphs, tables, diagrams or commentary in this material, which are provided for illustration/reference purposes only. The views, opinions, estimates and strategies expressed in this material constitute our judgment based on current market conditions and are subject to change without notice. JPM assumes no duty to update any information in this material in the event that such information changes. Views, opinions, estimates and strategies expressed herein may differ from those expressed by other areas of JPM, views expressed for other purposes or in other contexts, and this material should not be regarded as a research report. Any projected results and risks are based solely on hypothetical examples cited, and actual results and risks will vary depending on specific circumstances. Forward-looking statements should not be considered as guarantees or predictions of future events.
Nothing in this document shall be construed as giving rise to any duty of care owed to, or advisory relationship with, you or any third party. Nothing in this document shall be regarded as an offer, solicitation, recommendation or advice (whether financial, accounting, legal, tax or other) given by J.P. Morgan and/or its officers or employees, irrespective of whether or not such communication was given at your request. J.P. Morgan and its affiliates and employees do not provide tax, legal or accounting advice. You should consult your own tax, legal and accounting advisors before engaging in any financial transactions.
LEGAL ENTITY, BRAND & REGULATORY INFORMATION
In the United States, bank deposit accounts and related services, such as checking, savings and bank lending, are offered by JPMorgan Chase Bank, N.A. Member FDIC.
J.P. Morgan Wealth Management is a business of JPMorgan Chase & Co., which offers investment products and services through J.P. Morgan Securities LLC (JPMS), a registered broker-dealer and investment adviser, member FINRA and SIPC. Insurance products are made available through Chase Insurance Agency, Inc. (CIA), a licensed insurance agency, doing business as Chase Insurance Agency Services, Inc. in Florida. Certain custody and other services are provided by JPMorgan Chase Bank, N.A. (JPMCB). JPMS, CIA and JPMCB are affiliated companies under the common control of JPMorgan Chase & Co. Products not available in all states.
Bank deposit accounts and related services, such as checking, savings and bank lending, are offered by JPMorgan Chase Bank, N.A. Member FDIC.
This document may provide information about the brokerage and investment advisory services provided by J.P. Morgan Securities LLC (“JPMS”). The agreements entered into with JPMS, and corresponding disclosures provided with respect to the different products and services provided by JPMS (including our Form ADV disclosure brochure, if and when applicable), contain important information about the capacity in which we will be acting. You should read them all carefully. We encourage clients to speak to their JPMS representative regarding the nature of the products and services and to ask any questions they may have about the difference between brokerage and investment advisory services, including the obligation to disclose conflicts of interests and to act in the best interests of our clients.
J.P. Morgan may hold a position for itself or our other clients which may not be consistent with the information, opinions, estimates, investment strategies or views expressed in this document. JPMorgan Chase & Co. or its affiliates may hold a position or act as market maker in the financial instruments of any issuer discussed herein or act as an underwriter, placement agent, advisor or lender to such issuer.


Check the background of our firm and investment professionals on FINRA's BrokerCheck
To learn more about J.P. Morgan Wealth Management’s investment business, including our accounts, products and services, as well as our relationship with you, please review our J.P. Morgan Securities LLC Form CRS and Guide to Investment Services and Brokerage Products.
This website is for informational purposes only, and not an offer, recommendation or solicitation of any product, strategy service or transaction. Any views, strategies or products discussed on this site may not be appropriate or suitable for all individuals and are subject to risks. Prior to making any investment or financial decisions, an investor should seek individualized advice from a personal financial, legal, tax and other professional advisors that take into account all of the particular facts and circumstances of an investor's own situation.
This website may provide information about the brokerage and investment advisory services provided by J.P. Morgan Securities LLC ("JPMS"). When JPMS acts as a broker-dealer, a client's relationship with us and our duties to the client will be different in some important ways than a client's relationship with us and our duties to the client when we are acting as an investment advisor. A client should carefully read the agreements and disclosures received (including our Form ADV disclosure brochure, if and when applicable) in connection with our provision of services for important information about the capacity in which we will be acting.
INVESTMENT AND INSURANCE PRODUCTS ARE:
• NOT FDIC INSURED • NOT INSURED BY ANY FEDERAL GOVERNMENT AGENCY • NOT A DEPOSIT OR OTHER OBLIGATION OF, OR GUARANTEED BY, JPMORGAN CHASE BANK, N.A. OR ANY OF ITS AFFILIATES • SUBJECT TO INVESTMENT RISKS, INCLUDING POSSIBLE LOSS OF THE PRINCIPAL AMOUNT INVESTED

J.P. Morgan Wealth Management is a business of JPMorgan Chase & Co., which offers investment products and services through J.P. Morgan Securities LLC (JPMS), a registered broker-dealer and investment adviser, member FINRA and SIPC Insurance products are made available through Chase Insurance Agency, Inc. (CIA), a licensed insurance agency, doing business as Chase Insurance Agency Services, Inc. in Florida. Certain custody and other services are provided by JPMorgan Chase Bank, N.A. (JPMCB). JPMS, CIA and JPMCB are affiliated companies under the common control of JPMorgan Chase & Co. Products not available in all states.
Please read additional Important Information in conjunction with these pages.
You're now leaving J.P. Morgan
J.P. Morgan’s website and/or mobile terms, privacy and security policies don’t apply to the site or app you're about to visit. Please review its terms, privacy and security policies to see how they apply to you. J.P. Morgan isn’t responsible for (and doesn’t provide) any products, services or content at this third-party site or app, except for products and services that explicitly carry the J.P. Morgan name.