

Key takeaways

  • Job growth so far in 2026 is positive, but momentum cooled in June as payroll gains came in below expectations and prior months were revised down.
  • The unemployment rate remains low, but the latest dip in the jobless rate coincided with lower labor force participation.
  • Wage growth is steady, but purchasing power depends on whether it outpaces inflation.
  • The broader hiring backdrop looks cooler than payroll headlines alone might reveal. Job openings, quits and layoffs help explain why switching jobs may feel harder, even with a low unemployment rate.

Contributors

Sergei Klebnikov

Editorial Staff, J.P. Morgan Wealth Management

Halfway through 2026, the U.S. labor market is sending mixed signals. Hiring has stayed positive overall, but recent data indicates a cooler pace than earlier in the spring.

The latest payrolls report showed slow job gains in June, alongside downward revisions to prior months. Meanwhile, unemployment remains low, but changes in labor force participation are shaping what that really means for workers and employers.1

So far this year, the U.S. economy has added an average of 92,000 jobs each month. While that’s up from last year – when the economy added an average of just 10,000 jobs per month – this year’s number is still down from 2024’s average of 122,000 jobs added per month.2

Still, our strategists contend that the U.S. labor market isn’t a source of excess inflationary pressures at present.

“The labor market is moderating, not collapsing, with hiring trends stable and wage growth contained,” Joe Seydl, Senior Markets Economist at J.P. Morgan Private Bank, said. “Slowing labor demand and a dip in participation warrant monitoring, but the backdrop remains constructive for both the economy and markets.”

The most recent payrolls report offers several insights for employers and job seekers. A low unemployment rate can signal a healthy economy, but that doesn’t always mean it’s easy to find a new role. When hiring slows and job openings cool, job seekers may face longer searches and have less leverage on pay, even if the headline unemployment rate remains low.

Let’s walk through five indicators – payrolls, unemployment, participation, wages, and the Job Openings and Labor Turnover Survey (JOLTS) – to explain what’s happened so far in 2026 and what to watch for next.

The labor market indicators that matter most in 2026 – and why

The U.S. Department of Labor’s Bureau of Labor Statistics (BLS) conducts and publishes two big surveys every month. The household survey asks individuals about their work status – whether they’re employed, unemployed (including whether they’ve been actively looking) or out of the labor force – and it’s the source of the unemployment rate. The establishment survey collects payroll information from employers to estimate nonfarm payroll job growth and report measures like hours worked and average hourly earnings. Because one counts people and the other counts payroll jobs, the two can give investors different reads from month to month.

Payroll job growth measures the monthly change in the number of nonfarm payroll jobs in the economy. This is the headline number from the BLS report that most market participants watch. The unemployment rate, meanwhile, is the percentage of the labor force that is unemployed – people who are jobless and actively seeking work. Another closely watched metric is the labor force participation rate, which measures the percentage of the working-age population that is either working or actively looking for work.

Investors who are closely watching these indicators may want to remember, though, that no single number tells the whole story. For example, unemployment can remain low even as hiring slows, because it’s a rate, not a headcount. If fewer people are actively looking for work, then the labor force shrinks and the unemployment rate can fall even if job creation cools. That’s why pairing unemployment with participation and employment-to-population rates may help investors spot when the labor market is truly tightening versus simply less active.

What’s more, payrolls data is subject to revisions after being released, meaning that investors may want to focus on long-term trends rather than any given month’s headline numbers.

Why the Fed watches the labor market (and why investors should, too)

When payrolls, participation and wages move in different directions, that can change the market’s view of whether the Federal Reserve (Fed) is more likely to raise, cut or hold rates steady. Hiring and wage trends may provide a glimpse into whether the economy is reaccelerating or weakening (along with inflation and other indicators).

In 2025, concerns about plummeting job growth and rising unemployment led the Fed to cut the federal funds rate three times in the fall, by a total of 75 basis points. While job growth was tepid at the start of 2026, it has rebounded strongly in recent months, with April’s and May’s reports in particular helping shift market expectations around the future direction of Fed policy.

For investors, the labor market matters because it shapes expectations for Fed policy and, in turn, Treasury yields. Hotter-than-expected jobs or wage data can push markets toward a more restrictive policy outlook, lifting yields and weighing on bond prices. Weaker labor data can have the opposite effect if it increases expectations for easier monetary policy.

Some investors watch the 2-year Treasury yield as a barometer of Fed policy expectations, while the 10-year is often viewed as a longer-term signal that incorporates inflation and growth expectations (and other factors). Many long-term investors choose to stay focused on goals, maintain diversification and rebalance thoughtfully rather than reposition around every data release.

Jobs report 2026: Are employers still adding payroll jobs?

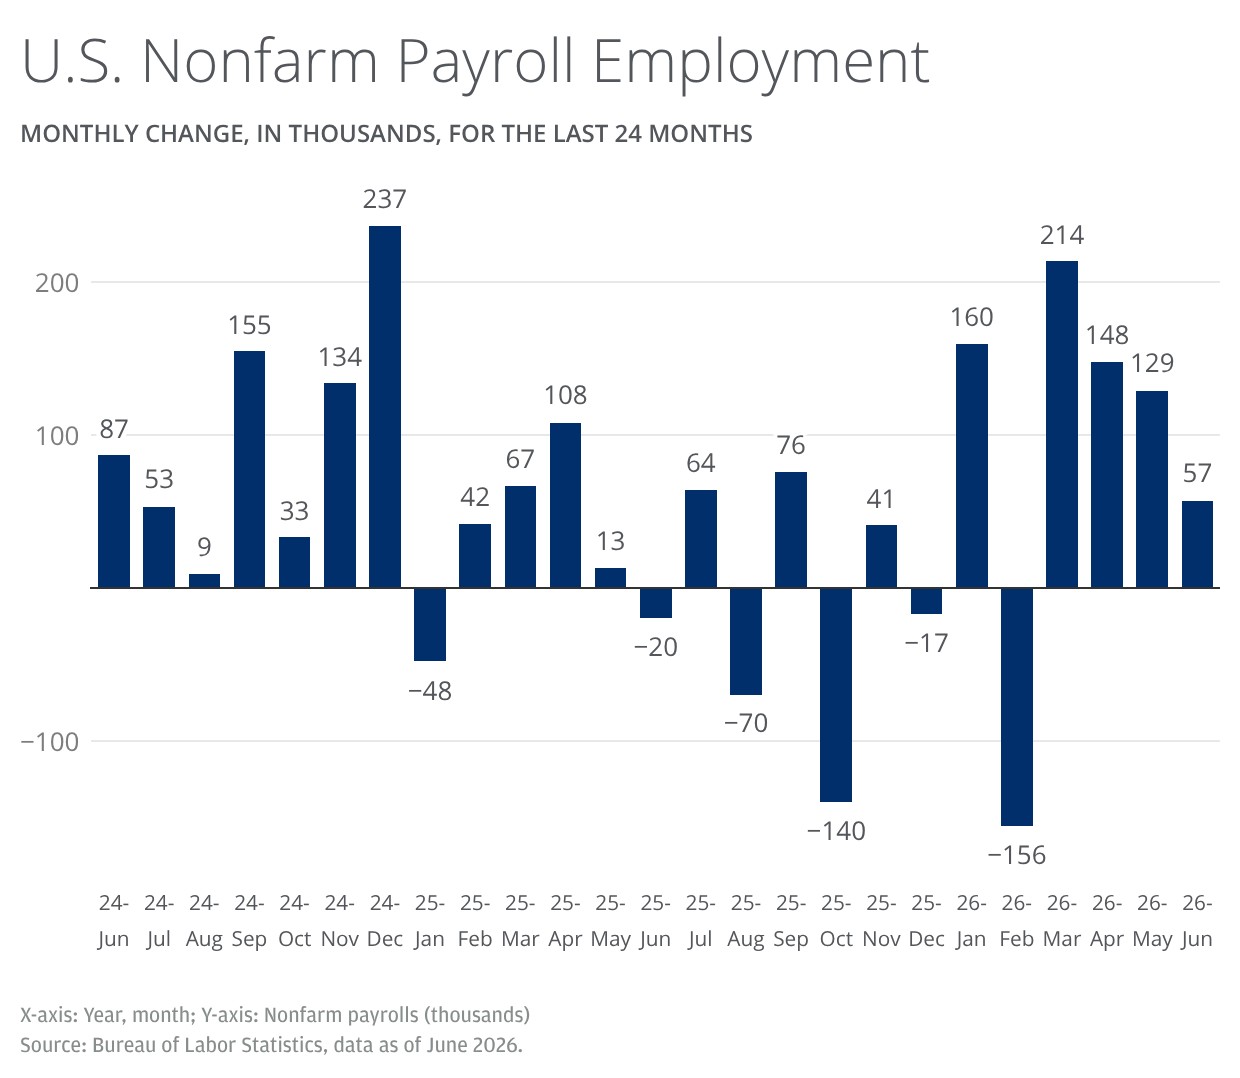
In June, employers added only 57,000 jobs for the month, well below the 113,000 expected. What’s more, payroll gains for the two prior months were revised downward by 74,000.

While the economy has added fewer new jobs, hiring has still been positive in recent months. June marked the fourth consecutive monthly increase in payrolls, which have stabilized from late 2025. So far in 2026, the U.S. economy has added 506,000 jobs in total.3

That’s well above last year’s slump, which saw only 181,000 new jobs created – with a large part of the 2026 gains driven by hiring in healthcare and social work.4 While job growth has rebounded from uncertainty late last year, it’s still well below the growth rate seen in 2024, when 1.46 million jobs were added in total.5

The bar chart shows the monthly change in U.S. nonfarm payroll employment, measured in thousands of jobs, from June 2024 through June 2026.

Employment in healthcare and social assistance continued to trend upward in June, adding 22,000 and 25,000 jobs, respectively. Professional and business services also trended up, continuing a strong run since a recent low in October 2025 and rising by 36,000 jobs in June.

Leisure and hospitality employment declined by 61,000 in June, however, which reflects weaker-than-usual seasonal hiring. That’s a volatile swing from the 40,000 jobs added in the industry in May.6

Other major industries – such as mining, oil and gas, construction, manufacturing, retail trade, transportation and warehousing, financial services and government – saw little or no change month over month (MOM).7

One month of payrolls data can be “noisy.” Seasonal quirks, temporary disruptions (from weather, strikes, etc.) and the fact that payrolls are often revised in subsequent releases can all distort the headline number. A practical way to reduce the noise is to watch the three-month average of job gains and assess whether job growth is broadening across sectors or narrowing to a handful of categories.

Unemployment rate in 2026: Low, rising or stuck?

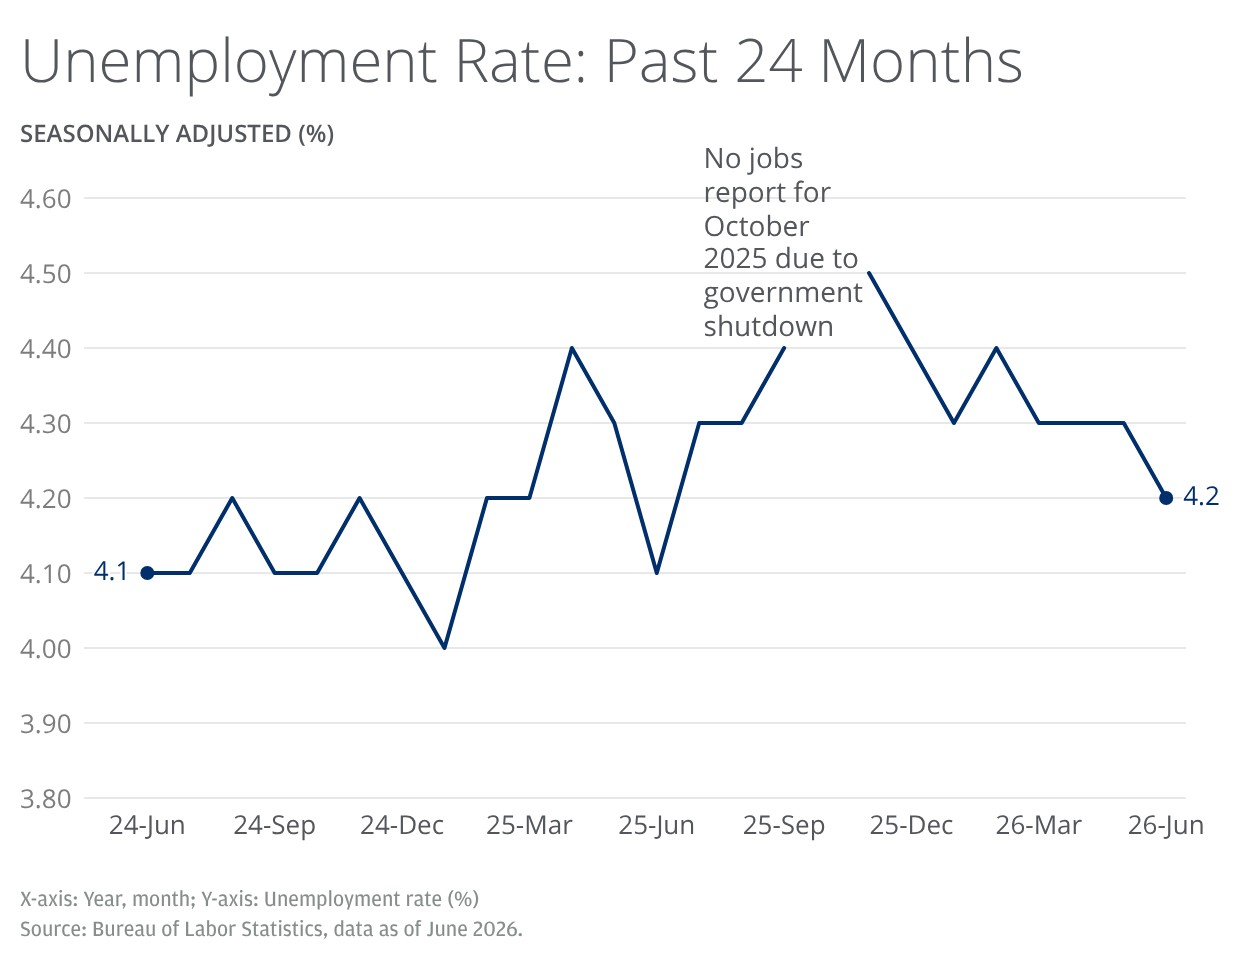
Over the past few years, unemployment has remained low compared to historical standards. The unemployment rate fell slightly to 4.2% in June 2026, down from 4.3% in May, but the downtick was primarily due to a drop in labor participation month over month.8

The line chart shows the seasonally adjusted U.S. unemployment rate, measured in percent, from June 2024 through June 2026, and includes a note stating there is no jobs report for October 2025 due to a government shutdown.

Low unemployment typically means workers can switch jobs more easily; with fewer available job candidates relative to openings, employers may have to compete for talent. In a cooling labor market, though, unemployment can remain low even while job switching feels harder if job openings and hiring rates are trending down. Workers may stay put longer in that case, or employers may post fewer roles, meaning it can take more time for job seekers to land a comparable job.

Labor force participation: Are more people working – or sitting out?

The labor force participation rate, which measures the percentage of the working-age population that is currently employed or seeking employment, is another closely watched metric alongside unemployment. Labor force participation came in at 61.5% in June, down from 61.8% in May and 62.3% this time last year. Roughly 2 million workers have left the labor force since December 2025.9

Another useful lens is the employment-to-population ratio, which helps contextualize employment even when participation is moving. The prime working-age (25-54) employment-to-population ratio can be especially informative because it’s less affected by retirement trends. In June, the prime-age reading fell by 0.6% to 80.2% overall, its weakest level since 2022.10 Our strategists see the falling working-age employment population as evidence backing our core view that the U.S. labor market isn’t a source of inflationary pressures at present.

“The June jobs data was weak across the board relative to expectations, taking out much of the strength that was apparent in prior months,” Seydl said. “There is still an apparent disconnect where the establishment survey is sending a more inflationary signal than the household survey.”

Wage growth in 2026: Are paychecks keeping up with inflation?

Wage growth can be measured in nominal terms (not adjusted for inflation) or in real terms (after inflation). For example, if wages rise 3.5% but inflation is around 4%, purchasing power can still be flat or down.

Wage growth came in at expectations in June, growing by 0.3% from May. Average hourly earnings for workers grew by just 3.5% on an annual basis, in line with expectations.11

Recent data suggests that higher energy prices – predominantly influenced by conflict in the Middle East – have pushed headline inflation above wage growth, weighing on purchasing power. As the Fed navigates back toward its 2% target, cooling wage growth suggests the labor market is less likely to be a key source of inflation pressure; for households, what matters most is whether pay gains outpace cost-of-living increases.

Hiring is more than ‘jobs added’: What job openings, quits and layoffs say in 2026

Another metric that may help explain the overall feel of the job market is the BLS’ Job Openings and Labor Turnover Survey (JOLTS). The latest survey showed that job openings were unchanged at 7.6 million in May. Hires were unchanged at 5.2 million, while total separations were little changed at 5.1 million. Within separations, there were 3.1 million quits and 1.7 million layoffs.12

JOLTS data can sometimes be volatile, however; and, like payrolls, it is often revised after publication. Investors may want to focus on the long-term direction of the data and multi-month trends rather than over-relying on headline numbers from any given month.

So, what does this mean for employees and job seekers? In general, people are less likely to leave their current job if they aren’t confident there are other employment opportunities to be had. If job openings fall, that can also mean longer searches for people actively seeking employment.

The bottom line: What the 2026 job market means for job seekers, workers and employers

For job seekers, a cooler hiring pace can mean longer job searches and more competition for roles in certain sectors. For workers, a slowing job market can mean that switching jobs may take longer, or that pay increases may be more closely tied to performance and skills rather than to broad-based wage growth. For employers, normalizing labor demand can be an opportunity to hire thoughtfully and choose from more candidates. Participation trends still matter, however: If fewer workers are entering or staying in the labor force, competition for talent can remain elevated.

Federal Reserve officials will be watching labor market indicators closely ahead of the next Federal Open Market Committee (FOMC) meeting on July 28-29. Along with inflation trends and current financial conditions, labor market momentum plays a key role in shaping the Fed’s decision on whether to change interest rates.

Looking ahead, the July jobs report, which will be released on August 7, will help clarify whether June’s soft reading was a one-off or the start of a broader downshift. Key items to watch include revisions to prior payrolls, whether job gains broaden beyond a few sectors, whether participation stabilizes and whether wage growth cools further in inflation-adjusted terms.

For investors, it may be best to stay the course rather than overreact to one month of data. Jobs reports can be noisy and market expectations for Fed policy can often shift quickly when payrolls, labor force participation and wages send mixed signals. Consider focusing on the fundamentals you can control, such as maintaining diversification, rebalancing when allocations drift and ensuring your portfolio still matches your time horizon and risk tolerance. If rate volatility persists, you can work with a financial professional who can help translate changes in the economic outlook into a plan that is aligned with your goals.

References

1.

Bureau of Labor Statistics (BLS), “The Employment Situation – June 2026.” (July 2, 2026)

2.

National Association of Homebuilders, “Labor Market Cools While Construction Industry Faces Headwinds.” (July 7, 2026)

3.

BLS, “The Employment Situation – June 2026.” (July 2, 2026)

4.

BLS, “The Employment Situation – January 2026.” (February 11, 2026)

5.

NBC News, “U.S. Had Almost No Job Growth in 2025.” (February 11, 2026)

6.

BLS, “The Employment Situation – June 2026.” (July 2, 2026)

7.

BLS, “The Employment Situation – June 2026.” (July 2, 2026)

8.

BLS, “The Employment Situation – June 2026.” (July 2, 2026)

9.

BLS, “The Employment Situation – June 2026.” (July 2, 2026)

10.

Federal Reserve Bank of St. Louis, “Employment-Population Ratio - 25-54 Yrs.” (Accessed July 9, 2026)

11.

BLS, “The Employment Situation – June 2026.” (July 2, 2026)

12.

BLS, “Job Openings and Labor Turnover – May 2026.” (June 30, 2026)


Connect with a Wealth Advisor

Reach out to your Wealth Advisor to discuss any considerations for your current portfolio. If you don’t have a Wealth Advisor, click here to tell us about your needs and we’ll reach out to you.

Connect now

IMPORTANT INFORMATION

This material is for informational purposes only, and may inform you of certain products and services offered by J.P. Morgan’s wealth management businesses, part of JPMorgan Chase & Co. (“JPM”). Products and services described, as well as associated fees, charges and interest rates, are subject to change in accordance with the applicable account agreements and may differ among geographic locations. Not all products and services are offered at all locations. If you are a person with a disability and need additional support accessing this material, please contact your J.P. Morgan team or email us at accessibility.support@jpmorgan.com for assistance. Please read all Important Information.

Investing in alternative investment strategies is speculative, often involves a greater degree of risk than traditional investments including limited liquidity and limited transparency, among other factors and should only be considered by sophisticated investors with the financial capability to accept the loss of all or part of the assets devoted to such strategies.

GENERAL RISKS & CONSIDERATIONSAny views, strategies or products discussed in this material may not be appropriate for all individuals and are subject to risks. Investors may get back less than they invested, and past performance is not a reliable indicator of future results. Asset allocation/diversification does not guarantee a profit or protect against loss. Nothing in this material should be relied upon in isolation for the purpose of making an investment decision. You are urged to consider carefully whether the services, products, asset classes (e.g. equities, fixed income, alternative investments, commodities, etc.) or strategies discussed are suitable to your needs. You must also consider the objectives, risks, charges, and expenses associated with an investment service, product or strategy prior to making an investment decision. For this and more complete information, including discussion of your goals/situation, contact your J.P. Morgan representative.

NON-RELIANCECertain information contained in this material is believed to be reliable; however, JPM does not represent or warrant its accuracy, reliability or completeness, or accept any liability for any loss or damage (whether direct or indirect) arising out of the use of all or any part of this material. No representation or warranty should be made with regard to any computations, graphs, tables, diagrams or commentary in this material, which are provided for illustration/reference purposes only. The views, opinions, estimates and strategies expressed in this material constitute our judgment based on current market conditions and are subject to change without notice. JPM assumes no duty to update any information in this material in the event that such information changes. Views, opinions, estimates and strategies expressed herein may differ from those expressed by other areas of JPM, views expressed for other purposes or in other contexts, and this material should not be regarded as a research report. Any projected results and risks are based solely on hypothetical examples cited, and actual results and risks will vary depending on specific circumstances. Forward-looking statements should not be considered as guarantees or predictions of future events.

Nothing in this document shall be construed as giving rise to any duty of care owed to, or advisory relationship with, you or any third party. Nothing in this document shall be regarded as an offer, solicitation, recommendation or advice (whether financial, accounting, legal, tax or other) given by J.P. Morgan and/or its officers or employees, irrespective of whether or not such communication was given at your request. J.P. Morgan and its affiliates and employees do not provide tax, legal or accounting advice. You should consult your own tax, legal and accounting advisors before engaging in any financial transactions.

Legal Entity and Regulatory Information.

J.P. Morgan Wealth Management is a business of JPMorgan Chase & Co., which offers investment products and services through J.P. Morgan Securities LLC (JPMS), a registered broker-dealer and investment adviser, member FINRA and SIPC. Insurance products are made available through Chase Insurance Agency, Inc. (CIA), a licensed insurance agency, doing business as Chase Insurance Agency Services, Inc. in Florida. Certain custody and other services are provided by JPMorgan Chase Bank, N.A. (JPMCB). JPMS, CIA and JPMCB are affiliated companies under the common control of JPMorgan Chase & Co. Products not available in all states.

Bank deposit accounts and related services, such as checking, savings and bank lending, are offered by JPMorgan Chase Bank, N.A. Member FDIC.

This document may provide information about the brokerage and investment advisory services provided by J.P. Morgan Securities LLC (“JPMS”). The agreements entered into with JPMS, and corresponding disclosures provided with respect to the different products and services provided by JPMS (including our Form ADV disclosure brochure, if and when applicable), contain important information about the capacity in which we will be acting. You should read them all carefully. We encourage clients to speak to their JPMS representative regarding the nature of the products and services and to ask any questions they may have about the difference between brokerage and investment advisory services, including the obligation to disclose conflicts of interests and to act in the best interests of our clients.

J.P. Morgan may hold a position for itself or our other clients which may not be consistent with the information, opinions, estimates, investment strategies or views expressed in this document. JPMorgan Chase & Co. or its affiliates may hold a position or act as market maker in the financial instruments of any issuer discussed herein or act as an underwriter, placement agent, advisor or lender to such issuer.


Check the background of our firm and investment professionals on FINRA's BrokerCheck

To learn more about J. P. Morgan Wealth Management’s investment business, including our accounts, products and services, as well as our relationship with you, please review our J.P. Morgan Securities LLC Form CRS and Guide to Investment Services and Brokerage Products.

This website is for informational purposes only, and not an offer, recommendation or solicitation of any product, strategy service or transaction. Any views, strategies or products discussed on this site may not be appropriate or suitable for all individuals and are subject to risks. Prior to making any investment or financial decisions, an investor should seek individualized advice from a personal financial, legal, tax and other professional advisors that take into account all of the particular facts and circumstances of an investor's own situation. 

This website may provide information about the brokerage and investment advisory services provided by J.P. Morgan Securities LLC ("JPMS"). When JPMS acts as a broker-dealer, a client's relationship with us and our duties to the client will be different in some important ways than a client's relationship with us and our duties to the client when we are acting as an investment advisor. A client should carefully read the agreements and disclosures received (including our Form ADV disclosure brochure, if and when applicable) in connection with our provision of services for important information about the capacity in which we will be acting.

INVESTMENT AND INSURANCE PRODUCTS ARE:
• NOT FDIC INSURED • NOT INSURED BY ANY FEDERAL GOVERNMENT AGENCY • NOT A DEPOSIT OR OTHER OBLIGATION OF, OR GUARANTEED BY, JPMORGAN CHASE BANK, N.A. OR ANY OF ITS AFFILIATES • SUBJECT TO INVESTMENT RISKS, INCLUDING POSSIBLE LOSS OF THE PRINCIPAL AMOUNT INVESTED

J.P. Morgan Wealth Management is a business of JPMorgan Chase & Co., which offers investment products and services through J.P. Morgan Securities LLC (JPMS), a registered broker-dealer and investment adviser, member FINRA and SIPC Insurance products are made available through Chase Insurance Agency, Inc. (CIA), a licensed insurance agency, doing business as Chase Insurance Agency Services, Inc. in Florida. Certain custody and other services are provided by JPMorgan Chase Bank, N.A. (JPMCB). JPMS, CIA and JPMCB are affiliated companies under the common control of JPMorgan Chase & Co. Products not available in all states.

Please read additional Important Information in conjunction with these pages.