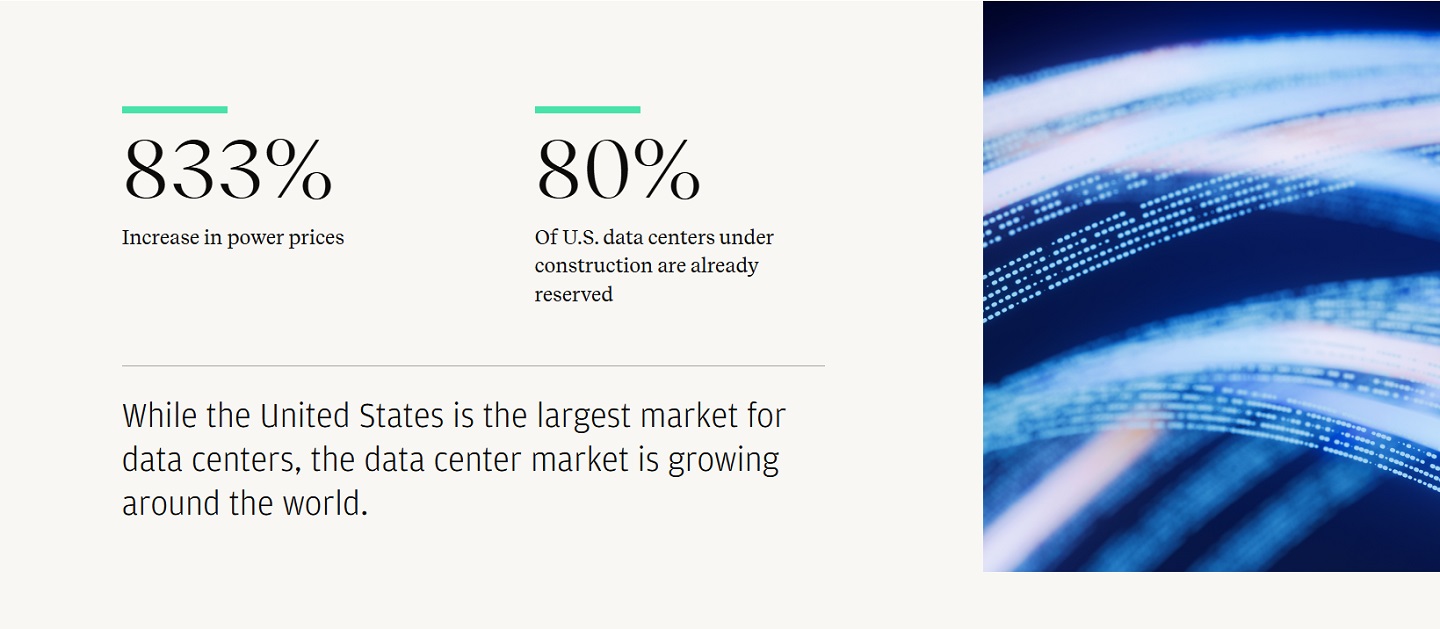
A recent U.S. power auction saw an 833% increase in power prices for the period from June 2025 to 2026.2

Contributors
Thomas Kennedy
Chief Investment Strategist for Global Wealth Management
Harry Downie
Global Investment Strategist, J.P. Morgan Wealth Management
Jay Serpe
Global Head of Alternative Investments, Strategy & Business Development
For decades, the term infrastructure has called to mind toll roads, electricity grids, airports, power and transportation networks – the backbone of an industrial economy.
Today, however, the term also includes new kinds of digital infrastructure, such as data centers needed for artificial intelligence (AI) and assets linked to the energy transition. As this chart shows, more than 65% of infrastructure is now exposed to these high-growth themes because they require so much power. (We will address the recent DeepSeek news, and its implications for power demand, later in this article.)
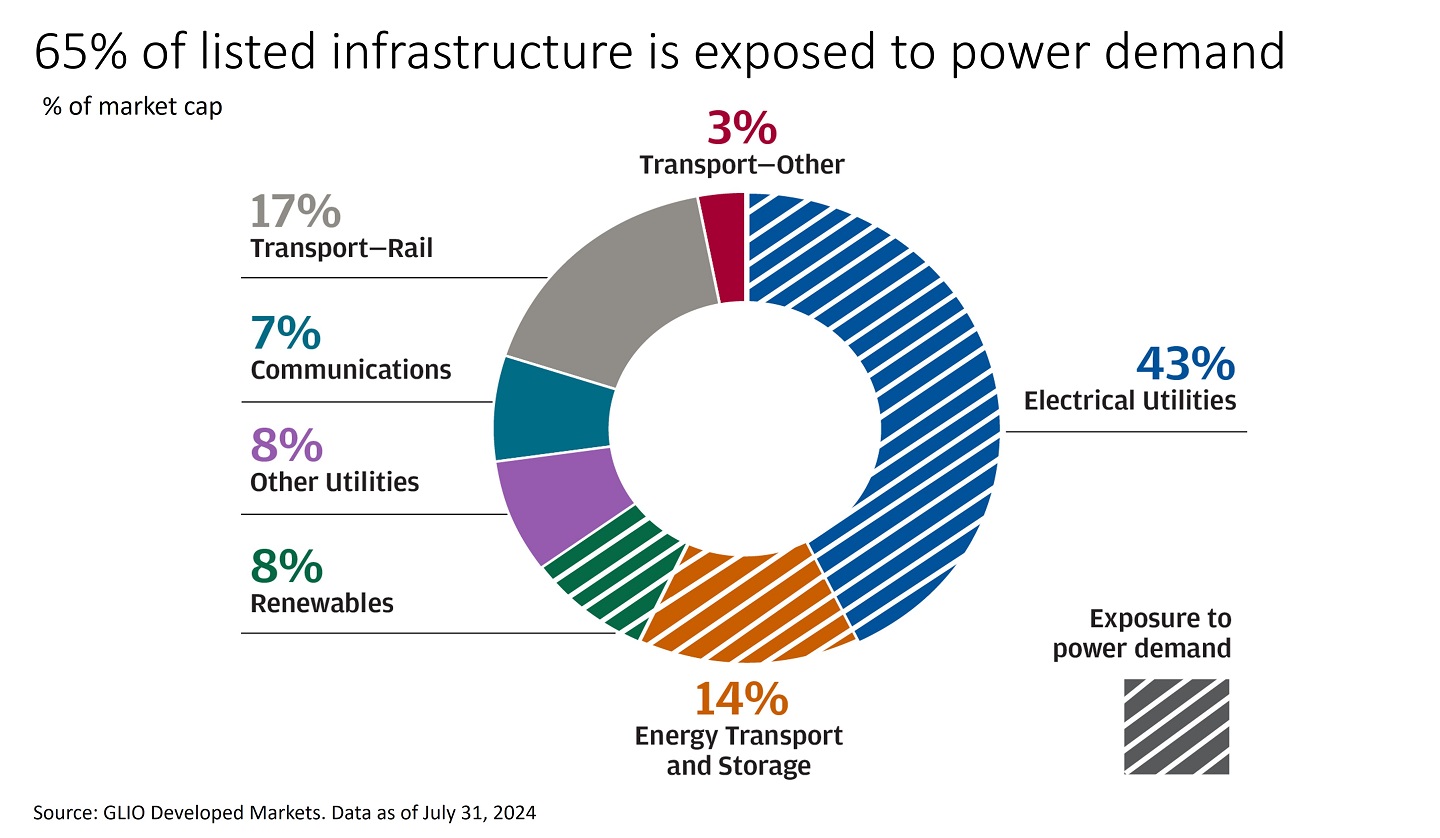
65% of listed infrastructure is exposed to power demand
Percentage of market cap
This chart shows the market cap percentage breakdown of infrastructure: 43% electrical utilities, 14% energy transport and storage, 8% renewables, 8% other utilities, 7% communications, 17% transport – rail, and 3% transport – other. 65% of listed infrastructure is exposed to power demand.
Source: GLIO Developed Markets. Data as of July 31, 2024
These long-lived assets tend to offer stable cash flows, making infrastructure attractive as a long-term position that can provide potential diversification and consistent income.
Now, with the powerful forces of AI and the energy transition serving as tailwinds, we believe infrastructure could potentially reverse its recent underperformance and deliver higher, sustainable earnings growth that will be reflected in asset prices. To understand why, let’s explore four questions:
- What will drive the value of infrastructure in the future? Why we see opportunity now.
- What has held back the total return for infrastructure? How an infrastructure investment works, and how it impacts pricing today.
- How does DeepSeek impact the AI infrastructure buildout?
- What does it mean for investors?
What will drive the value of infrastructure in the future?
We believe demand for infrastructure is at the beginning of a period of rapid growth. Data centers are at the heart of this, as they are necessary for AI – requiring more power from cleaner sources. This is having a global impact. While the United States is the largest market for data centers, accounting for roughly 40% of the global market, the data center market is growing around the world. In Europe, Latin America and Asia Pacific regions, data center inventory grew between 15% and 22% year over year in Q1 2024.1
Four key factors are driving this growth
The power utility that covers over 40% of data centers in the United States announced recently that large data centers will face a seven-year wait (up from four years previously) to connect to the electric grid due to a surge in requests.3
Approximately 80% of U.S. data centers under construction are already reserved by companies, and new data centers can take between one and three years to build.4
Past and current administrations have announced sizeable public-private investments focused on building out AI-related infrastructure in the United States.
While the United States is the largest market for data centers, the data center marketing is growing around the world.
- 833% increase in power prices
- 80% of U.S. data centers under construction are already reserved
Additionally, the cost of financing these assets is decreasing. The Federal Reserve cut interest rates by 100 basis points between September and December 2024, and we expect it to continue gradually normalizing rates going forward. This would reduce the discount rates applied to future cash flows, potentially increasing their present-day value.
What has held back the total return for infrastructure?
Consider an individual infrastructure project such as a wind farm. Builders typically finance these projects by borrowing money, which means taking on debt. For this reason, infrastructure companies have more than double the debt relative to their profits (Debt/EBITDA) of a typical U.S. company, as shown in the chart below.5
But once the wind farm is built, it generates electrical power that the owner sells to the operator of the grid. This income tends to be stable and can be sustained for a long time. As the chart below illustrates, infrastructure investments are about 24 years old on average, and their incomes are triple the dividend yield of the average S&P 500 company.
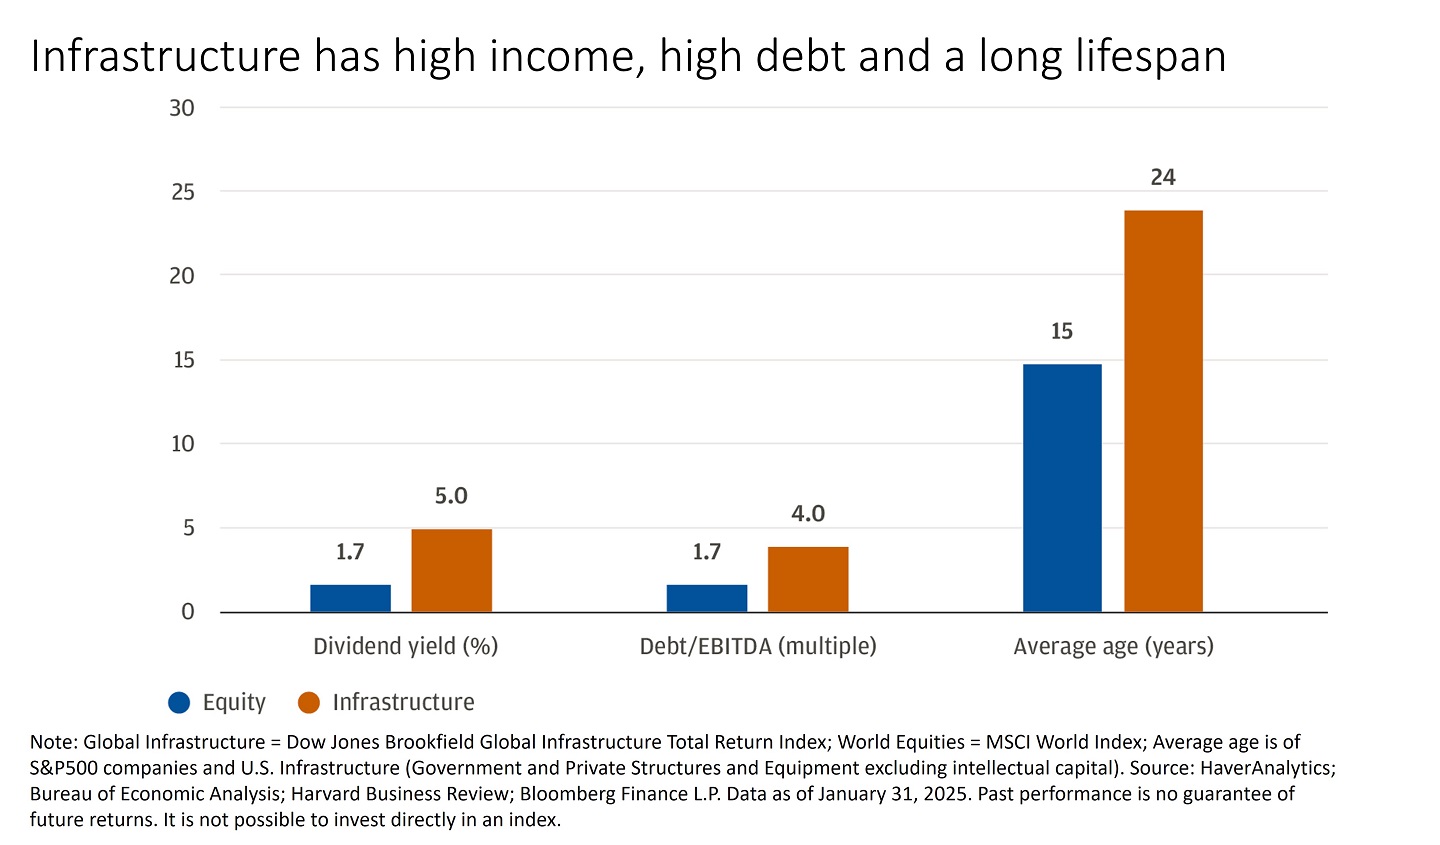
Infrastructure has high income, high debt and a long lifespan
The chart compares equity and infrastructure investments across three financial metrics: dividend yield, debt/EBITDA ratio and average age. It shows that infrastructure investments offer a higher dividend yield of 5.0% compared to 1.7% for equities. Infrastructure also has a higher debt/EBITDA ratio of 4.0, indicating more leverage compared to 1.7 for equities. Additionally, infrastructure investments have a longer average age of 24 years, compared to 15 years for equities, suggesting a longer investment horizon.
Note: Global Infrastructure = Dow Jones Brookfield Global Infrastructure Total Return Index; World Equities = MSCI World Index; Average age is of S&P500 companies and U.S. Infrastructure (Government and Private Structures and Equipment excluding intellectual capital). Source: HaverAnalytics; Bureau of Economic Analysis; Harvard Business Review; Bloomberg Finance L.P. Data as of January 31, 2025. Past performance is no guarantee of future returns. It is not possible to invest directly in an index.
That reliance on debt becomes a bigger issue when the cost of financing rises. This was easy to see, as the Fed quickly raised interest rates from almost zero to over 5% in 2022–23. U.S. wind power additions fell 30% in 2022 compared to 2021.6
Today, the pricing of this asset class reflects the increased cost of borrowing. However, we believe it overlooks the future values of infrastructure investments based on their expected profits and incomes, and our expectations for further declines in interest rates. This has the potential to drive stronger performance.
We see this as a suitable time to consider allocating to the space because we believe demand for infrastructure will continue to grow at a rapid clip. We think durable and high-growth themes in AI and the energy transition will support that growth.
How does DeepSeek impact the AI infrastructure buildout?
In January 2025, DeepSeek, a two-year-old AI startup based in China, unveiled a new AI model that reportedly performed on par with leading U.S. models. What was most interesting is that the DeepSeek model is 10 times more power efficient than one such model, Meta's Llama 3.1. We believe DeepSeek will help ease one of the obstacles to broad AI adoption: constraints on power generation. These constraints are driving up energy prices and making AI more expensive to use.
More power-efficient AI will be less costly to use, and we expect this to help to spread its productivity gains throughout the global economy. While estimates for AI’s eventual power needs vary widely, even the lowest estimates would require substantial growth in power generation. In December 2024, the Department of Energy projected that U.S. data center electricity demand could increase by 16% to 26% by 2028. The efficiency of DeepSeek makes it less likely that demand will reach the higher end of that range, but a 16% increase is very significant.
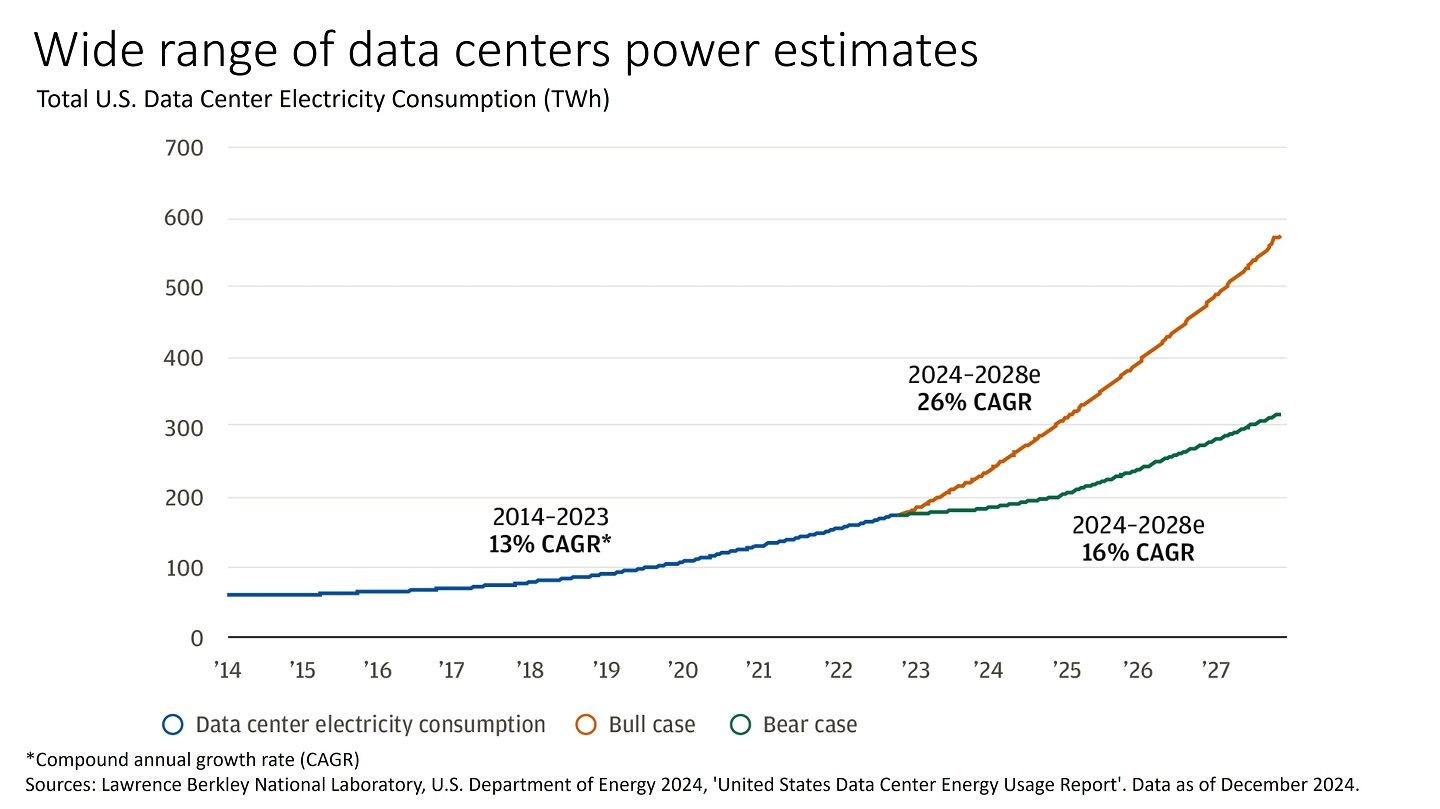
Wide range of data centers power estimates
Total U.S. Data Center Electricity Consumption (TWh)
The graph shows U.S. data center electricity consumption from 2014 to 2028 in TWh. From 2014 to 2023, consumption grew at a 13% CAGR. For 2024-2028, the Bull Case projects a 26% CAGR, reaching nearly 700 TWh, while the Bear Case projects a 16% CAGR, reaching around 400 TWh.
*Compound annual growth rate (CAGR)
Sources: Lawrence Berkley National Laboratory, U.S. Department of Energy 2024, 'United States Data Center Energy Usage Report'. Data as of December 2024.
Public companies recognize this investment opportunity, and they continue to surprise the market with their investment in AI infrastructure. In fact, after the DeepSeek announcement and the earnings report from Google parent Alphabet in February, the leading AI infrastructure providers are expected to grow capital expenditures by 29% year over year, up from prior forecast of 24%.7
What does it mean for investors?
We feel infrastructure is uniquely underpriced at present. As noted, we believe the market is underappreciating the strength and durability of the profits infrastructure assets can generate. We continue to believe AI is a powerful tailwind for these assets and believe the new administration is committed to accelerating this build-out.
To that end, President Donald Trump announced a joint venture between Open AI, SoftBank and Oracle called “Stargate” to fund artificial intelligence infrastructure. While further details are needed, the initial investment is said to total $100 billion, with an aim to increase to at least $500 billion over the next four years. This would equal the size of public and private investment from the CHIPS Act.8
In light of recent market turbulence, we believe investors can be underappreciating the value of infrastructure assets today. Infrastructure assets tend to offer stable cash flows, making infrastructure attractive as a long-term position that can provide potential diversification and consistent income.
Investors can gain exposure to infrastructure through both listed (public) and non-listed (private) investments. Historically, there has been little difference in the long-term median performance between the two. However, we believe non-listed infrastructure assets may offer slightly more attractive opportunities today due to discounted deal activity, as shown in the chart below. For new capital allocation, non-listed infrastructure provides the potential to deploy fresh capital at favorable valuations, enhancing the overall return potential.
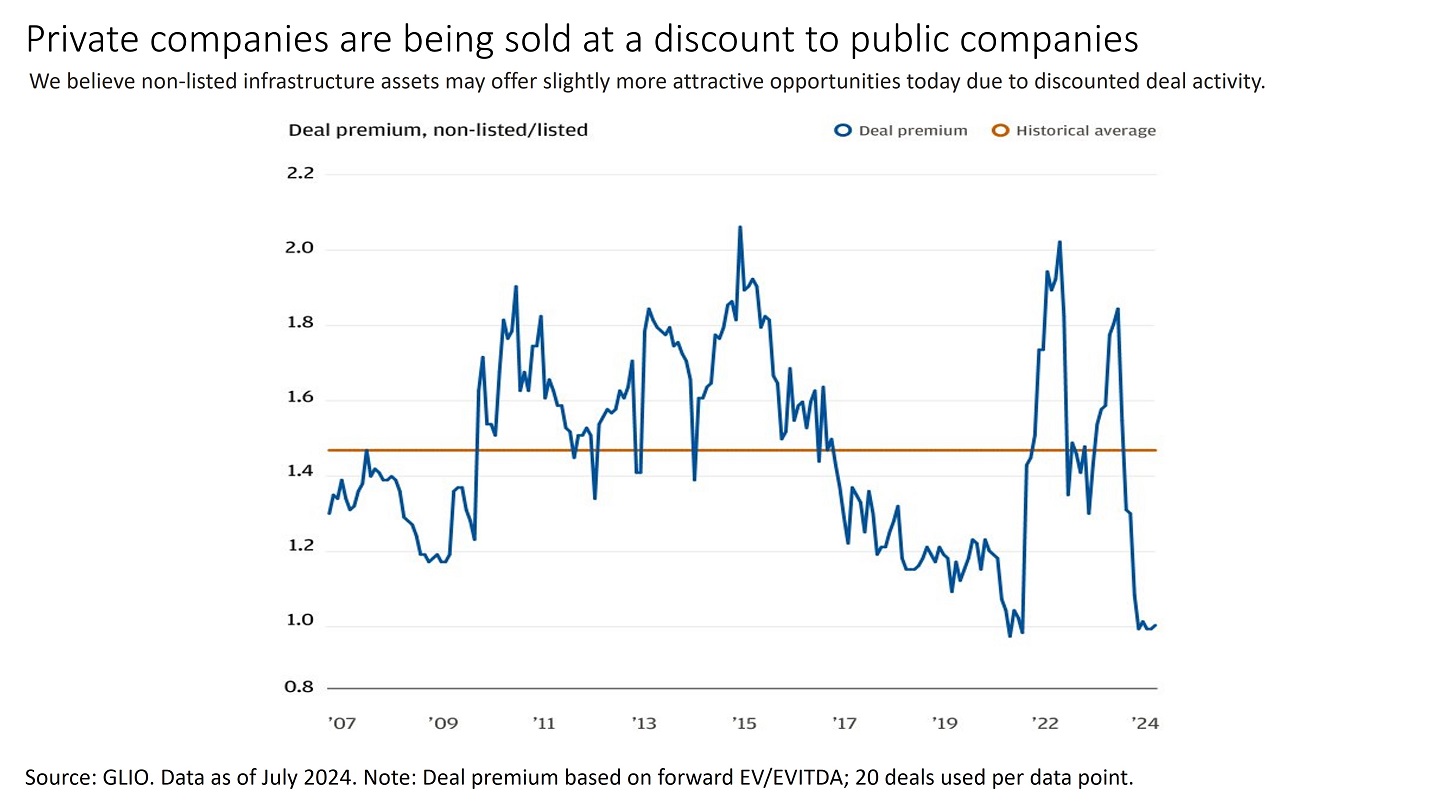
Private companies are being sold at a discount to public companies
We believe non-listed infrastructure assets may offer slightly more attractive opportunities today due to discounted deal activity.
This graph presents data on the deal premium of non-listed (private) companies compared to listed (public) companies. The data is based on forward EV/EBITDA, with 20 deals used per data point.
The vertical axis represents the deal premium, which is a ratio indicating how much more, on average, private companies are valued compared to public companies. The horizontal axis spans from the year 2007 to 2024, providing a historical perspective on the trend over this period.
The graph shows fluctuations in the deal premium over the years. Starting in 2007, the deal premium was slightly above 1.4. It experienced a decline in the following years, reaching a low point around 1.2 in 2009. This period coincides with the global financial crisis, which likely influenced the valuation of private companies.
From 2010 onwards, the deal premium began to rise, peaking at around 1.8 in 2011. However, the premium experienced volatility, with several peaks and troughs observed between 2011 and 2015.
In 2015, the deal premium stabilized around the historical average of 1.4. This stability continued until 2017, after which the premium began to decline again.
The period from 2017 to 2019 saw a gradual decrease in the deal premium, reaching a low point below 1.2 in 2019.
In 2020, the deal premium experienced a sharp increase, peaking at around 2.0 in 2021.
Following the peak in 2021, the deal premium declined sharply, returning to levels around the historical average of 1.4 by 2022.
In 2023 and 2024, the deal premium remained relatively stable, hovering around the historical average.
Source: GLIO. Data as of July 2024. Note: Deal premium based on forward EV/EVITDA; 20 deals used per data point.
We can help
Consult with your J.P. Morgan advisor to explore how you can incorporate infrastructure investments into your portfolio today.
References
1.
GLIO. Data as of December 31, 2023.
2.
Auction for PJM. PJM coordinates electricity movement across 14 states in the Eastern United States, including Virginia’s “Data Center Alley,” which covers ~20% of the U.S. population and over 40% of its data centers.
3.
The longer wait time applies only to large data centers that need more than 100 megawatts of electricity and won’t affect projects that have already been evaluated. Source: Bloomberg Finance L.P., August 30, 2024.
4.
CBRE, “North America Data Center Trends H1 2024.” (August 19, 2024)
5.
EBITDA refers to earnings before interest, taxes, depreciation and amortization. It is a measure of profit for a company.
6.
Bloomberg New Energy Finance (BNEF) Renewable Energy Project Database. Data as of June 11, 2024.
7.
Sources: Morgan Stanley; FactSet. Data as February 4, 2025.
8.
U.S. Department of Commerce $36 billion in proposed Government. Since the beginning of the Biden-Harris Administration, semiconductor and electronics companies have announced nearly $450 billion in private investments, catalyzed in large part by public investment. Public and private investments total about $500 billion. Data as of January 13, 2025.
Connect with a Wealth Advisor
Reach out to your Wealth Advisor to discuss any considerations for your current portfolio. If you don’t have a Wealth Advisor, click here to tell us about your needs and we’ll reach out to you.
IMPORTANT INFORMATION
This material is for informational purposes only, and may inform you of certain products and services offered by J.P. Morgan’s wealth management businesses, part of JPMorgan Chase & Co. (“JPM”). Products and services described, as well as associated fees, charges and interest rates, are subject to change in accordance with the applicable account agreements and may differ among geographic locations. Not all products and services are offered at all locations. If you are a person with a disability and need additional support accessing this material, please contact your J.P. Morgan team or email us at accessibility.support@jpmorgan.com for assistance. Please read all Important Information.
GENERAL RISKS & CONSIDERATIONS. Any views, strategies or products discussed in this material may not be appropriate for all individuals and are subject to risks. Investors may get back less than they invested, and past performance is not a reliable indicator of future results. Asset allocation/diversification does not guarantee a profit or protect against loss. Nothing in this material should be relied upon in isolation for the purpose of making an investment decision. You are urged to consider carefully whether the services, products, asset classes (e.g. equities, fixed income, alternative investments, commodities, etc.) or strategies discussed are suitable to your needs. You must also consider the objectives, risks, charges, and expenses associated with an investment service, product or strategy prior to making an investment decision. For this and more complete information, including discussion of your goals/situation, contact your J.P. Morgan representative.
NON-RELIANCE. Certain information contained in this material is believed to be reliable; however, JPM does not represent or warrant its accuracy, reliability or completeness, or accept any liability for any loss or damage (whether direct or indirect) arising out of the use of all or any part of this material. No representation or warranty should be made with regard to any computations, graphs, tables, diagrams or commentary in this material, which are provided for illustration/reference purposes only. The views, opinions, estimates and strategies expressed in this material constitute our judgment based on current market conditions and are subject to change without notice. JPM assumes no duty to update any information in this material in the event that such information changes. Views, opinions, estimates and strategies expressed herein may differ from those expressed by other areas of JPM, views expressed for other purposes or in other contexts, and this material should not be regarded as a research report. Any projected results and risks are based solely on hypothetical examples cited, and actual results and risks will vary depending on specific circumstances. Forward-looking statements should not be considered as guarantees or predictions of future events.
Nothing in this document shall be construed as giving rise to any duty of care owed to, or advisory relationship with, you or any third party. Nothing in this document shall be regarded as an offer, solicitation, recommendation or advice (whether financial, accounting, legal, tax or other) given by J.P. Morgan and/or its officers or employees, irrespective of whether or not such communication was given at your request. J.P. Morgan and its affiliates and employees do not provide tax, legal or accounting advice. You should consult your own tax, legal and accounting advisors before engaging in any financial transactions.
Legal Entity and Regulatory Information.
J.P. Morgan Wealth Management is a business of JPMorgan Chase & Co., which offers investment products and services through J.P. Morgan Securities LLC (JPMS), a registered broker-dealer and investment adviser, member FINRA and SIPC. Insurance products are made available through Chase Insurance Agency, Inc. (CIA), a licensed insurance agency, doing business as Chase Insurance Agency Services, Inc. in Florida. Certain custody and other services are provided by JPMorgan Chase Bank, N.A. (JPMCB). JPMS, CIA and JPMCB are affiliated companies under the common control of JPMorgan Chase & Co. Products not available in all states.
Bank deposit accounts and related services, such as checking, savings and bank lending, are offered by JPMorgan Chase Bank, N.A. Member FDIC.
This document may provide information about the brokerage and investment advisory services provided by J.P. Morgan Securities LLC (“JPMS”). The agreements entered into with JPMS, and corresponding disclosures provided with respect to the different products and services provided by JPMS (including our Form ADV disclosure brochure, if and when applicable), contain important information about the capacity in which we will be acting. You should read them all carefully. We encourage clients to speak to their JPMS representative regarding the nature of the products and services and to ask any questions they may have about the difference between brokerage and investment advisory services, including the obligation to disclose conflicts of interests and to act in the best interests of our clients.
J.P. Morgan may hold a position for itself or our other clients which may not be consistent with the information, opinions, estimates, investment strategies or views expressed in this document. JPMorgan Chase & Co. or its affiliates may hold a position or act as market maker in the financial instruments of any issuer discussed herein or act as an underwriter, placement agent, advisor or lender to such issuer.


Check the background of our firm and investment professionals on FINRA's BrokerCheck
To learn more about J. P. Morgan Wealth Management’s investment business, including our accounts, products and services, as well as our relationship with you, please review our J.P. Morgan Securities LLC Form CRS and Guide to Investment Services and Brokerage Products.
This website is for informational purposes only, and not an offer, recommendation or solicitation of any product, strategy service or transaction. Any views, strategies or products discussed on this site may not be appropriate or suitable for all individuals and are subject to risks. Prior to making any investment or financial decisions, an investor should seek individualized advice from a personal financial, legal, tax and other professional advisors that take into account all of the particular facts and circumstances of an investor's own situation.
This website may provide information about the brokerage and investment advisory services provided by J.P. Morgan Securities LLC ("JPMS"). When JPMS acts as a broker-dealer, a client's relationship with us and our duties to the client will be different in some important ways than a client's relationship with us and our duties to the client when we are acting as an investment advisor. A client should carefully read the agreements and disclosures received (including our Form ADV disclosure brochure, if and when applicable) in connection with our provision of services for important information about the capacity in which we will be acting.
INVESTMENT AND INSURANCE PRODUCTS ARE:
• NOT FDIC INSURED • NOT INSURED BY ANY FEDERAL GOVERNMENT AGENCY • NOT A DEPOSIT OR OTHER OBLIGATION OF, OR GUARANTEED BY, JPMORGAN CHASE BANK, N.A. OR ANY OF ITS AFFILIATES • SUBJECT TO INVESTMENT RISKS, INCLUDING POSSIBLE LOSS OF THE PRINCIPAL AMOUNT INVESTED

J.P. Morgan Wealth Management is a business of JPMorgan Chase & Co., which offers investment products and services through J.P. Morgan Securities LLC (JPMS), a registered broker-dealer and investment adviser, member FINRA and SIPC Insurance products are made available through Chase Insurance Agency, Inc. (CIA), a licensed insurance agency, doing business as Chase Insurance Agency Services, Inc. in Florida. Certain custody and other services are provided by JPMorgan Chase Bank, N.A. (JPMCB). JPMS, CIA and JPMCB are affiliated companies under the common control of JPMorgan Chase & Co. Products not available in all states.
Please read additional Important Information in conjunction with these pages.