
Contributors
Abigail Yoder
U.S. Equity Strategist, J.P. Morgan Global Wealth Management
Global Investment Strategist
US markets posted modest gains
Markets have navigated a mixed but resilient week, with major indices posting modest gains. The S&P 500 was slightly higher on the week, leading the index almost back to all-time highs. Macro data painted a nuanced picture: ADP private payrolls unexpectedly declined, reinforcing the dovish narrative ahead of next week’s Federal Open Market Committee (FOMC) meeting, where a rate cut is now widely anticipated. Early holiday shopping data is solid, but retailers report stress among lower-income consumers.
Artificial Intelligence (AI) remains a focal point as headlines this week highlight both innovation and fragmentation:
- OpenAI is set to launch a new reasoning model, aiming to reclaim technical leadership from Google’s Gemini 3.0 model, which was released last month and has been widely recognized for its advanced capabilities.
- Meta announced plans to cut as much as 30% of the budget for its metaverse group. This move signals to investors that Meta is refocusing resources on areas with better growth prospects.
- Microsoft shares fell after reports surfaced of lower AI sales quotas and targets for certain product lines, reflecting customer resistance to rapid adoption. However, Microsoft clarified that while quotas for some specific AI offerings have been reduced, overall company-wide AI sales quotas have not been cut.
Overall, markets are balancing optimism around monetary easing and earnings with caution over policy shifts and continuing unease over AI bubble concerns. Against this backdrop, one sector stands out for its recent turnaround: health care.
Health care as a preferred sector for investors
Recently, we upgraded health care to one of our preferred sectors – a notable change given its marked underperformance over the past three years. This is a trend shaped by several headwinds:
- COVID-19 digestion weighing on earnings growth: Life sciences and vaccine manufacturers expanded capacity during the pandemic, only to face excess supply and earnings pressure as demand normalized. On the other hand, managed care organizations initially benefited from lower costs driven by reduced doctor visits during and immediately after the pandemic, but are now seeing rising expenses as patients return with more complex needs.
- Policy overhang compressing valuations: Policy uncertainty, especially around drug pricing initiatives like the “most-favored nation” drug pricing proposal, has weighed on investor sentiment and sector valuations. For further information on the numerous overhangs, take a look at what Asset & Wealth Management Chair of Investment Strategy, Michael Cembalest, had to say in his piece Sick as a Dog (PDF).
So, what changed to get us more positive? Here are the three main reasons.
Policy overhang easing
Since last November’s election, policy uncertainty has emerged as a significant headwind for health care valuations. The Trump administration introduced a series of proposals aimed at curbing profitability for various industries, which weighed on investor sentiment and contributed to valuation compression across the sector.
One of the most impactful proposals was the “most-favored nation” drug pricing initiative, which aimed to align U.S. drug prices with those in other developed countries that are oftentimes two to three times less than in the U.S. for a variety of reasons. If implemented, it would have materially affected revenue and margins for pharmaceutical companies and had downstream effects for various other industries as well, such as life sciences companies.
However, in late September, Pfizer became the first major pharmaceutical company to reach an agreement with the administration on drug pricing, removing a significant policy overhang. The deal granted Medicaid access to most-favored-nation-style pricing and expanded discounted direct-to-patient purchasing, helping to resolve this concern and set a precedent for others. Several additional agreements have followed, helping health care become the best-performing sector quarter-to-date (+7% versus S&P 500 +1%). With policy headwinds easing, there is now room for sector valuations to recover from compressed levels.
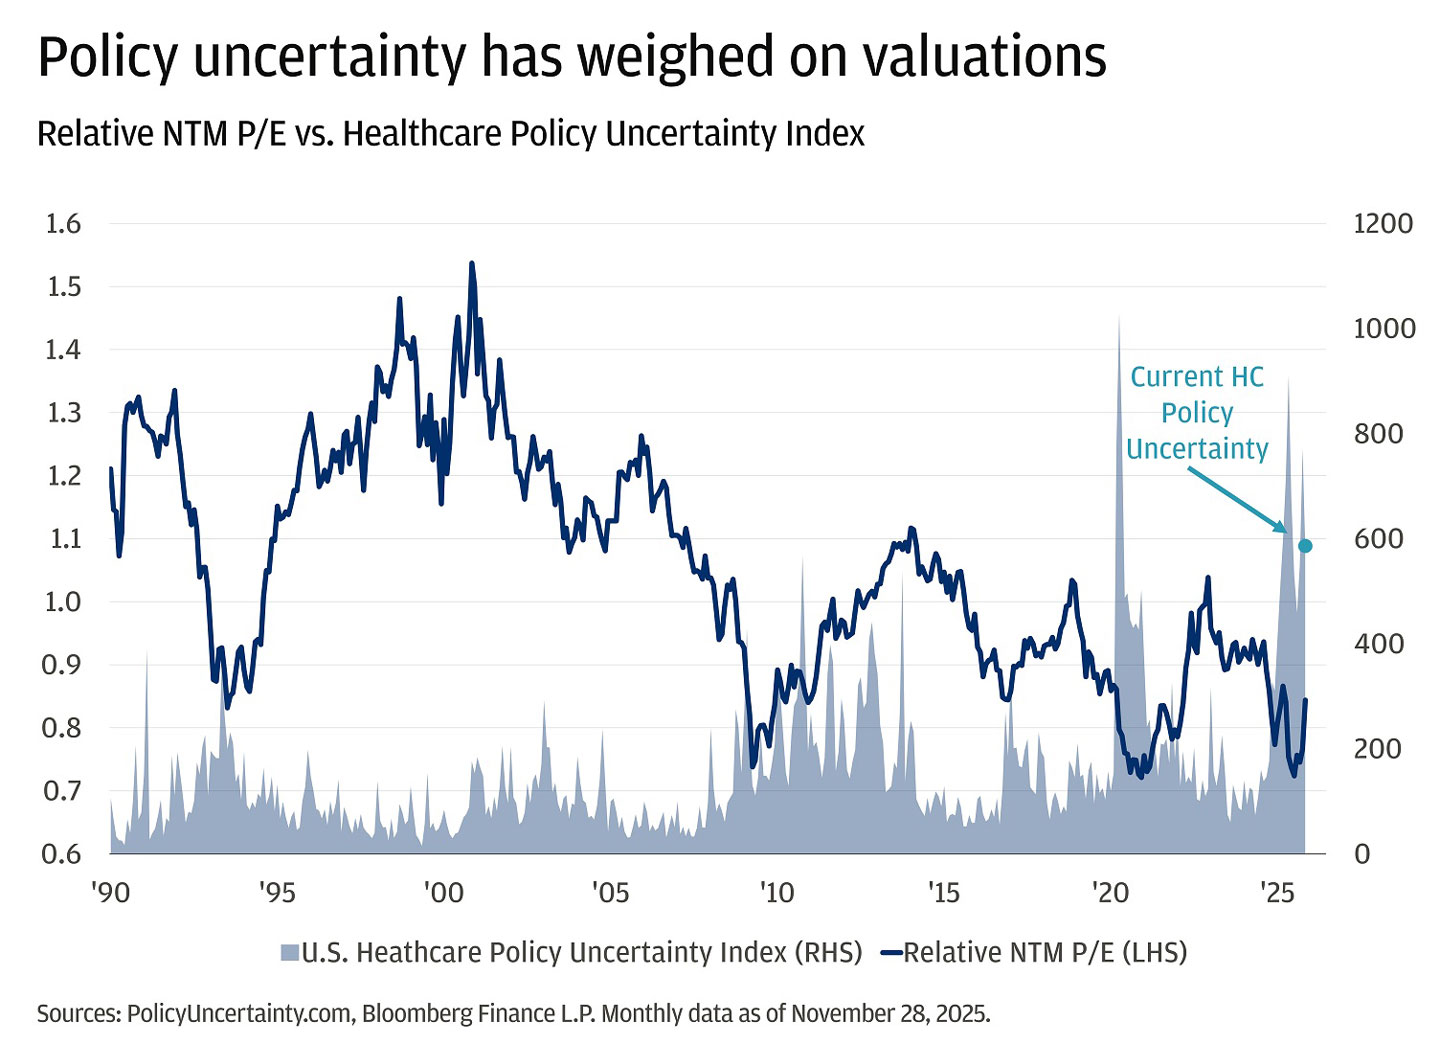
Policy uncertainty has weighed on valuations
Relative NTM P/E vs. Healthcare Policy Uncertainty Index
This chart shows the Relative NTM P/E ratio and the U.S. Healthcare Policy Uncertainty Index from 1990 to 2025. The Relative NTM P/E ratio fluctuates between about 0.7 and 1.5, peaking above 1.5 around 2000 and trending lower to around 0.9 in 2025. The Healthcare Policy Uncertainty Index remains mostly below 200, with a few short spikes to 300-400, until 2020. Then the index spikes briefly to 1000 before falling back to 200. In 2025, the index again spiked near 1000 and ends in November 2025 just below 600.
Sources: PolicyUncertainty.com, Bloomberg Finance L.P. Monthly data as of November 28, 2025.
Earnings clarity and stabilization
Third-quarter results have provided incremental clarity around where some of the more pressured industries were heading in terms of earnings growth. Life sciences and managed care are showing signs of bottoming as their end markets stabilize and reprice their insurance books, respectively, which allowed them to maintain 2026 guidance. The sector’s relative earnings revisions breadth – which measures the balance between upward and downward analyst estimate changes – has stabilized, and health care companies have beaten Q3 estimates by 13%, well above the broad market’s 7% and the highest beat rate in at least two years. This supports a more constructive setup for earnings growth in 2026.
Historically, health care has outpaced the broader market in earnings growth over the past 30 years. However, in the last five years, the sector has shifted to underperforming the market in terms of earnings growth. The recent stabilization in earnings and guidance from industry leaders suggests the worst may be behind us.
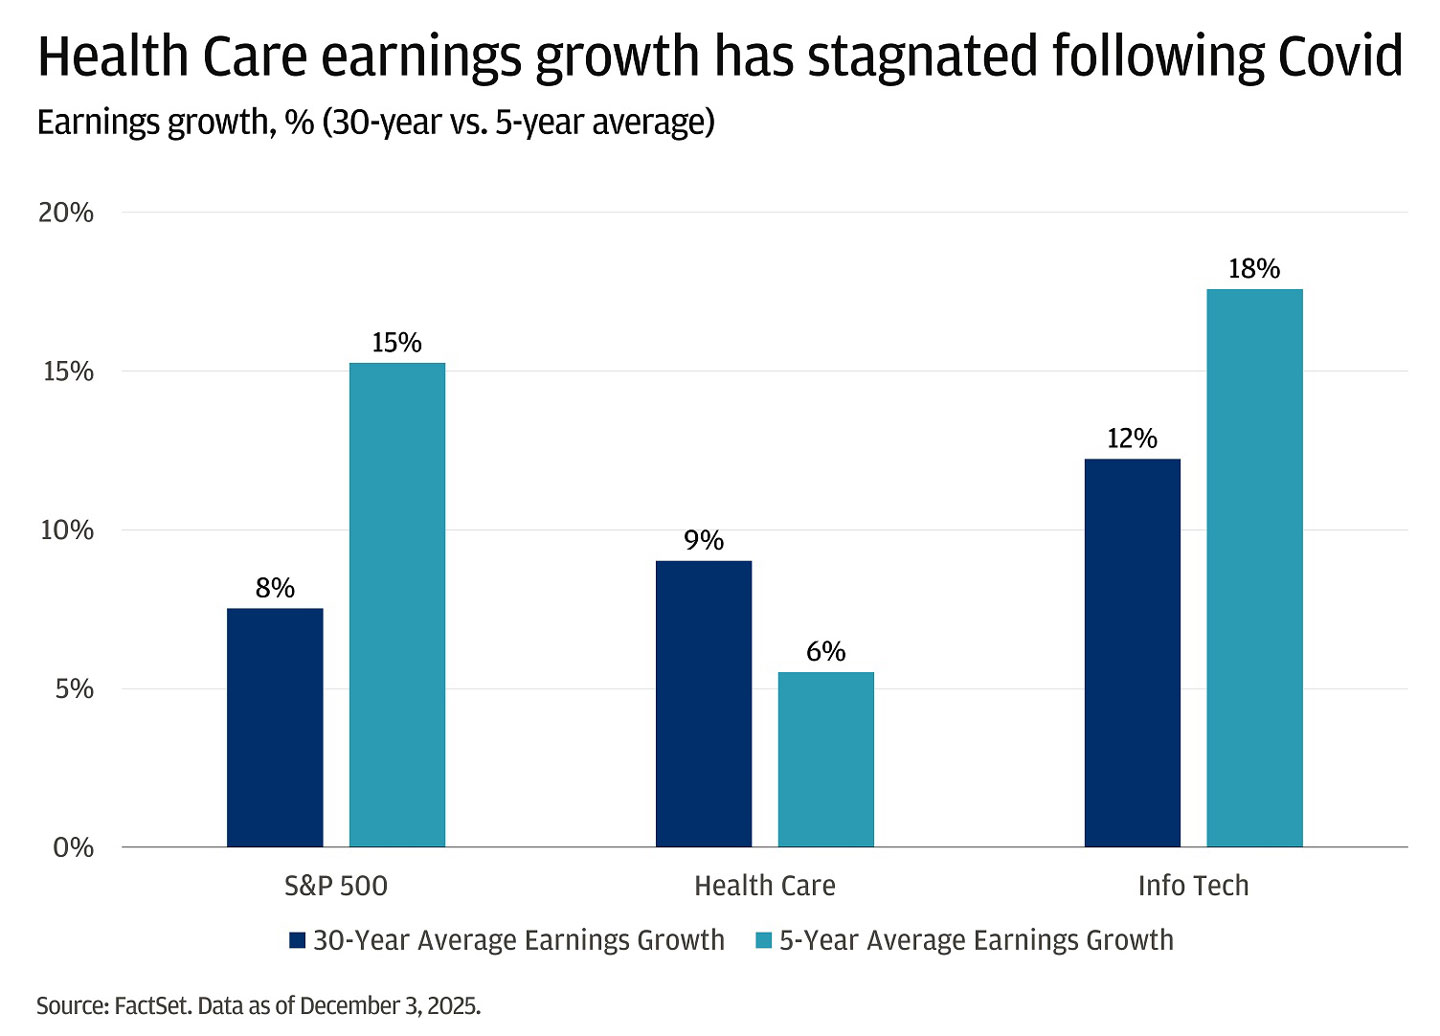
Health Care earnings growth has stagnated following Covid
Earnings growth, % (30-year vs. 5-year average)
This bar chart shows earnings growth percentages for the S&P 500, Health Care, and Info Tech sectors, comparing 30-year and 5-year averages.
- For the S&P 500, the 30-year average earnings growth is 8%, while the 5-year average is 15%.
- In Health Care, the 30-year average is 9% and the 5-year average is 6%.
- For Info Tech, the 30-year average is 12% and the 5-year average is 18%.
Source: FactSet. Data as of December 3, 2025.
Accelerating M&A activity
Mergers and acquisitions (M&A) have historically been a primary way for health care companies to sustain and grow their revenue pipelines, especially as existing drugs approach patent expiration. When blockbuster drugs lose patent protection, companies face significant revenue declines. To address this, firms typically pursue one of two strategies: develop new drugs internally and secure new patents, or acquire companies that already have promising drugs in development or on the market. Given the high costs, long timelines and risks associated with internal drug development, M&A has become a popular and effective method for quickly replenishing product pipelines and maintaining growth.
After a slow start to the year due to policy uncertainty, M&A activity has picked up meaningfully since Labor Day. Biotech, in particular, has averaged one deal per week, making it the busiest sector for deal activity. If this pace continues, overall health care M&A is on track for its strongest year since 2021.
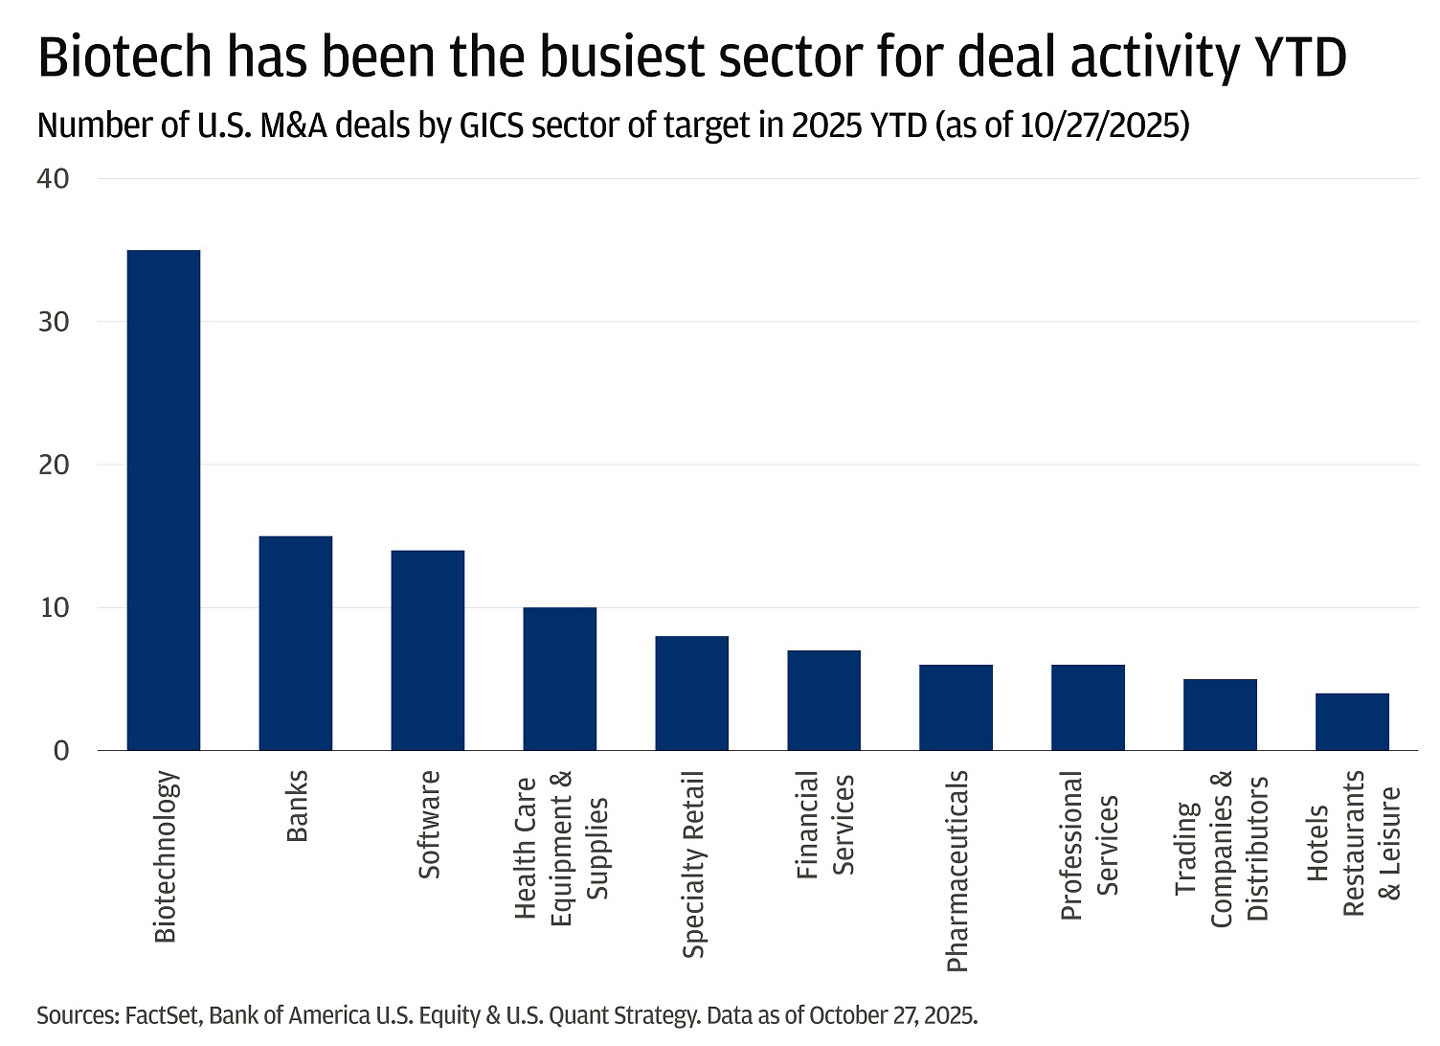
Biotech has been the busiest sector for deal activity YTD
Number of U.S. M&A deals by GICS sector of target in 2025 YTD (as of 10/27/2025)
This bar chart shows the number of U.S. M&A deals by GICS sector of target for the year-to-date in 2025.
- Biotechnology leads with 35 deals, making it the busiest sector by a wide margin.
- Banks show 15 deals.
- Software shows 14 deals.
- Health Care Equipment & Supplies accounts for 10 deals.
- Specialty Retail has 8 deals. Financial Services recorded 7 deals.
- Both Pharmaceuticals and Professional Services have 6 deals each.
- Trading Companies & Distributors saw 5 deals.
- Hotels, Restaurants & Leisure is the lowest, with 4 deals.
Sources: FactSet, Bank of America U.S. Equity & U.S. Quant Strategy. Data as of October 27, 2025.
This has ramifications for small-cap biotech, as they are often the primary acquisition targets. However, it also impacts large-cap pharma and biotech companies, which are looking to fill their pipelines as they approach significant patent cliffs through the end of the decade. It is estimated that over $150 billion in revenues will go off patent for large-cap pharma/biotech companies by 2030, representing about 30% of revenue per company on average.
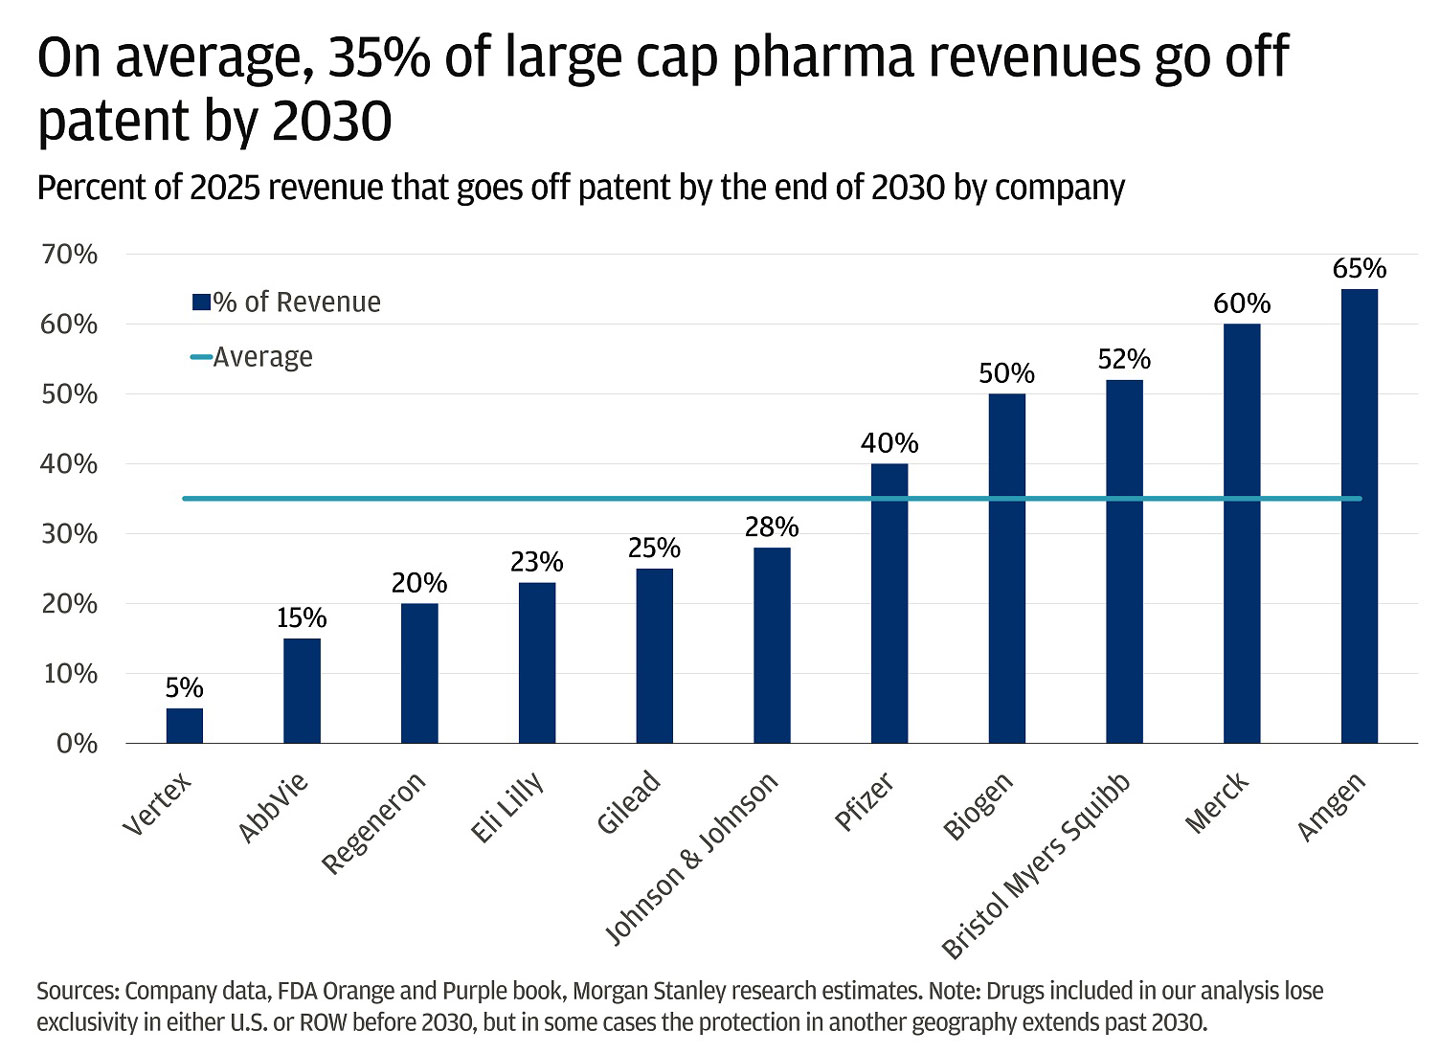
On average, 35% of large cap pharma revenues go off patent by 2030
Percent of 2025 revenue that goes off patent by the end of 2030 by company
This bar chart shows the percentage of 2025 revenue for major pharmaceutical companies that is expected to go off patent by the end of 2030. The companies and their respective percentages are:
- Vertex (5%)
- Abbvie (15%)
- Regeneron (20%)
- Eli Lilly (23%)
- Gilead (25%)
- J&J (28%)
- Pfizer (40%)
- Biogen (50%)
- Bristol Myers Squibb (52%)
- Merck (60%)
- Amgen (65%)
The average across these companies is 35%.
Sources: Company data, FDA Orange and Purple book, Morgan Stanley research estimates. Note: Drugs included in our analysis lose exclusivity in either U.S. or ROW before 2030, but in some cases the protection in another geography extends past 2030.
The bottom line
In summary, after years of headwinds, the health care sector is showing signs of stabilization and renewed momentum. We think that the improving earnings clarity, easing policy pressures and accelerating M&A activity are positioning the sector for a more constructive outlook in 2026 and beyond.
All market and economic data as of 12/05/25 are sourced from Bloomberg Finance L.P. and FactSet unless otherwise stated.
Connect with a Wealth Advisor
Reach out to your Wealth Advisor to discuss any considerations for your current portfolio. If you don’t have a Wealth Advisor, click here to tell us about your needs and we’ll reach out to you.
DISCLOSURES
The information presented is not intended to be making value judgments on the preferred outcome of any government decision or political election.
Index definitions:
The Solactive United States 2000 Index intends to track the performance of the largest 1001 to 3000 companies from the United States stock market. Constituents are selected based on company market capitalization and weighted by free float market capitalization.
The Russell 3000 Index is a capitalization-weighted stock market index that seeks to be a benchmark of the entire U.S. stock market. It measures the performance of the largest 3,000 U.S. companies representing approximately 96% of the investable U.S. equity market.
The S&P 500 Equal Weight Index is the equal-weight version of the widely-used S&P 500. The index includes the same constituents as the capitalization weighted S&P 500, but each company in the S&P 500 EWI is allocated a fixed weight of the index total at each quarterly rebalance.
The Bloomberg U.S. Aggregate Bond Index is a broad-based flagship benchmark that measures the investment grade, US dollar-denominated, fixed-rate taxable bond market. The index includes Treasuries, government-related and corporate securities, MBS (agency fixed-rate pass-throughs), ABS and CMBS (agency and non-agency).
The Magnificent Seven stocks are a group of influential companies in the U.S. stock market: Alphabet, Amazon, Apple, Meta Platforms, Microsoft, NVIDIA, and Tesla.
The Magnificent 7 Index is an equal-dollar weighted equity benchmark consisting of a fixed basket of 7 widely-traded companies (Microsoft, Apple, Nvidia, Alphabet, Amazon, Meta, Tesla) classified in the United States and representing the Communications, Consumer Discretionary and Technology sectors as defined by Bloomberg Industry Classification System (BICS).
The S&P Midcap 400 Index is a capitalization-weighted index which measures the performance of the mid-range sector of the U.S. stock market.
The S&P 500 index is widely regarded as the best single gauge of large-cap U.S. equities and serves as the foundation for a wide range of investment products. The index includes 500 leading companies and captures approximately 80% coverage of available market capitalization.
Bonds are subject to interest rate risk, credit, call, liquidity and default risk of the issuer. Bond prices generally fall when interest rates rise.
Standard and Poor’s 500 Index is a capitalization-weighted index of 500 stocks. The index is designed to measure performance of the broad domestic economy through changes in the aggregate market value of 500 stocks representing all major industries. The index was developed with a base level of 10 for the 1941–43 base period.
The Bloomberg Eco Surprise Index shows the degree to which economic analysts under- or over-estimate the trends in the business cycle. The surprise element is defined as the percentage difference between analyst forecasts and the published value of economic data releases.
The MSCI World Index is a free float-adjusted market capitalization index that is designed to measure global developed market equity performance.
The NASDAQ 100 Index is a basket of the 100 largest, most actively traded U.S companies listed on the NASDAQ stock exchange. The index includes companies from various industries except for the financial industry, like commercial and investment banks. These non-financial sectors include retail, biotechnology, industrial, technology, health care, and others.
The Russell 2000 Index measures small company stock market performance. The index does not include fees or expenses.
We believe the information contained in this material to be reliable but do not warrant its accuracy or completeness. Opinions, estimates, and investment strategies and views expressed in this document constitute our judgment based on current market conditions and are subject to change without notice.
The views, opinions, estimates and strategies expressed herein constitutes the author's judgment based on current market conditions and are subject to change without notice, and may differ from those expressed by other areas of J.P. Morgan. This information in no way constitutes J.P. Morgan Research and should not be treated as such. You should carefully consider your needs and objectives before making any decisions. For additional guidance on how this information should be applied to your situation, you should consult your advisor.
All companies referenced are shown for illustrative purposes only, and are not intended as a recommendation or endorsement by J.P. Morgan in this context.
JPMorgan Chase & Co., its affiliates, and employees do not provide tax, legal or accounting advice. Information presented on these webpages is not intended to provide, and should not be relied on for tax, legal and accounting advice. You should consult your own tax, legal and accounting advisors before engaging in any financial transaction.
RISK CONSIDERATIONS
- Past performance is not indicative of future results. You may not invest directly in an index.
- The price of equity securities may rise or fall due to the changes in the broad market or changes in a company's financial condition, sometimes rapidly or unpredictably. Equity securities are subject to 'stock market risk' meaning that stock prices in general may decline over short or extended periods of time.
- Investing in fixed income products is subject to certain risks, including interest rate, credit, inflation, call, prepayment and reinvestment risk. Any fixed income security sold or redeemed prior to maturity may be subject to substantial gain or loss.
- In general, the bond market is volatile and bond prices rise when interest rates fall and vice versa. Longer term securities are more prone to price fluctuation than shorter term securities. Any fixed income security sold or redeemed prior to maturity may be subject to substantial gain or loss. Dependable income is subject to the credit risk of the issuer of the bond. If an issuer defaults no future income payments will be made.
- When investing in mutual funds or exchange-traded and index funds, please consider the investment objectives, risks, charges, and expenses associated with the funds before investing. You may obtain a fund’s prospectus by contacting your investment professional. The prospectus contains information, which should be carefully read before investing.
- Investors should understand the potential tax liabilities surrounding a municipal bond purchase. Certain municipal bonds are federally taxed if the holder is subject to alternative minimum tax. Capital gains, if any, are federally taxable. The investor should note that the income from tax-free municipal bond funds may be subject to state and local taxation and the alternative minimum tax (amt).
- International investments may not be suitable for all investors. International investing involves a greater degree of risk and increased volatility. Changes in currency exchange rates and differences in accounting and taxation policies outside the u.s. can raise or lower returns. Some overseas markets may not be as politically and economically stable as the united states and other nations. Investments in international markets can be more volatile.
- Investments in emerging markets may not be suitable for all investors. Emerging markets involve a greater degree of risk and increased volatility. Changes in currency exchange rates and differences in accounting and taxation policies outside the u.s. can raise or lower returns. Some overseas markets may not be as politically and economically stable as the united states and other nations. Investments in emerging markets can be more volatile.
- Investments in commodities may have greater volatility than investments in traditional securities, particularly if the instruments involve leverage. The value of commodity-linked derivative instruments may be affected by changes in overall market movements, commodity index volatility, changes in interest rates, or factors affecting a particular industry or commodity, such as drought, floods, weather, livestock disease, embargoes, tariffs and international economic, political and regulatory developments. Use of leveraged commodity-linked derivatives creates an opportunity for increased return but, at the same time, creates the possibility for greater loss.
- Real estate investments trusts may be subject to a high degree of market risk because of concentration in a specific industry, sector or geographical sector. Real estate investments may be subject to risks including, but not limited to, declines in the value of real estate, risks related to general and economic conditions, changes in the value of the underlying property owned by the trust and defaults by borrower.
- Investment in alternative investment strategies is speculative, often involves a greater degree of risk than traditional investments including limited liquidity and limited transparency, among other factors and should only be considered by sophisticated investors with the financial capability to accept the loss of all or part of the assets devoted to such strategies.
- Structured products involve derivatives and risks that may not be suitable for all investors. The most common risks include, but are not limited to, risk of adverse or unanticipated market developments, issuer credit quality risk, risk of lack of uniform standard pricing, risk of adverse events involving any underlying reference obligations, risk of high volatility, risk of illiquidity/little to no secondary market, and conflicts of interest. Before investing in a structured product, investors should review the accompanying offering document, prospectus or prospectus supplement to understand the actual terms and key risks associated with the each individual structured product. Any payments on a structured product are subject to the credit risk of the issuer and/or guarantor. Investors may lose their entire investment, i.e., incur an unlimited loss. The risks listed above are not complete. For a more comprehensive list of the risks involved with this particular product, please speak to your J.P. Morgan team.
- As a reminder, hedge funds (or funds of hedge funds) often engage in leveraging and other speculative investment practices that may increase the risk of investment loss. These investments can be highly illiquid, and are not required to provide periodic pricing or valuation information to investors, and may involve complex tax structures and delays in distributing important tax information. These investments are not subject to the same regulatory requirements as mutual funds; and often charge high fees. Further, any number of conflicts of interest may exist in the context of the management and/or operation of any such fund. For complete information, please refer to the applicable offering memorandum.
- For informational purposes only -- J.P. Morgan Securities LLC does not endorse, advise on, transmit, sell or transact in any type of virtual currency. Please note: J.P. Morgan Securities LLC does not intermediate, mine, transmit, custody, store, sell, exchange, control, administer, or issue any type of virtual currency, which includes any type of digital unit used as a medium of exchange or a form of digitally stored value.
- The prices and rates of return are indicative, as they may vary over time based on market conditions.
- Additional risk considerations exist for all strategies.
- The information provided herein is not intended as a recommendation of or an offer or solicitation to purchase or sell any investment product or service.
- Opinions expressed herein may differ from the opinions expressed by other areas of J.P. Morgan. This material should not be regarded as investment research or a J.P. Morgan investment research report.


Check the background of our firm and investment professionals on FINRA's BrokerCheck
To learn more about J. P. Morgan Wealth Management’s investment business, including our accounts, products and services, as well as our relationship with you, please review our J.P. Morgan Securities LLC Form CRS and Guide to Investment Services and Brokerage Products.
This website is for informational purposes only, and not an offer, recommendation or solicitation of any product, strategy service or transaction. Any views, strategies or products discussed on this site may not be appropriate or suitable for all individuals and are subject to risks. Prior to making any investment or financial decisions, an investor should seek individualized advice from a personal financial, legal, tax and other professional advisors that take into account all of the particular facts and circumstances of an investor's own situation.
This website may provide information about the brokerage and investment advisory services provided by J.P. Morgan Securities LLC ("JPMS"). When JPMS acts as a broker-dealer, a client's relationship with us and our duties to the client will be different in some important ways than a client's relationship with us and our duties to the client when we are acting as an investment advisor. A client should carefully read the agreements and disclosures received (including our Form ADV disclosure brochure, if and when applicable) in connection with our provision of services for important information about the capacity in which we will be acting.
INVESTMENT AND INSURANCE PRODUCTS ARE:
• NOT FDIC INSURED • NOT INSURED BY ANY FEDERAL GOVERNMENT AGENCY • NOT A DEPOSIT OR OTHER OBLIGATION OF, OR GUARANTEED BY, JPMORGAN CHASE BANK, N.A. OR ANY OF ITS AFFILIATES • SUBJECT TO INVESTMENT RISKS, INCLUDING POSSIBLE LOSS OF THE PRINCIPAL AMOUNT INVESTED

J.P. Morgan Wealth Management is a business of JPMorgan Chase & Co., which offers investment products and services through J.P. Morgan Securities LLC (JPMS), a registered broker-dealer and investment adviser, member FINRA and SIPC Insurance products are made available through Chase Insurance Agency, Inc. (CIA), a licensed insurance agency, doing business as Chase Insurance Agency Services, Inc. in Florida. Certain custody and other services are provided by JPMorgan Chase Bank, N.A. (JPMCB). JPMS, CIA and JPMCB are affiliated companies under the common control of JPMorgan Chase & Co. Products not available in all states.
Please read additional Important Information in conjunction with these pages.